- Most MATIC addresses are “out of the money”
- Declining whale transactions may reduce short-term volatility and support a bullish reversal
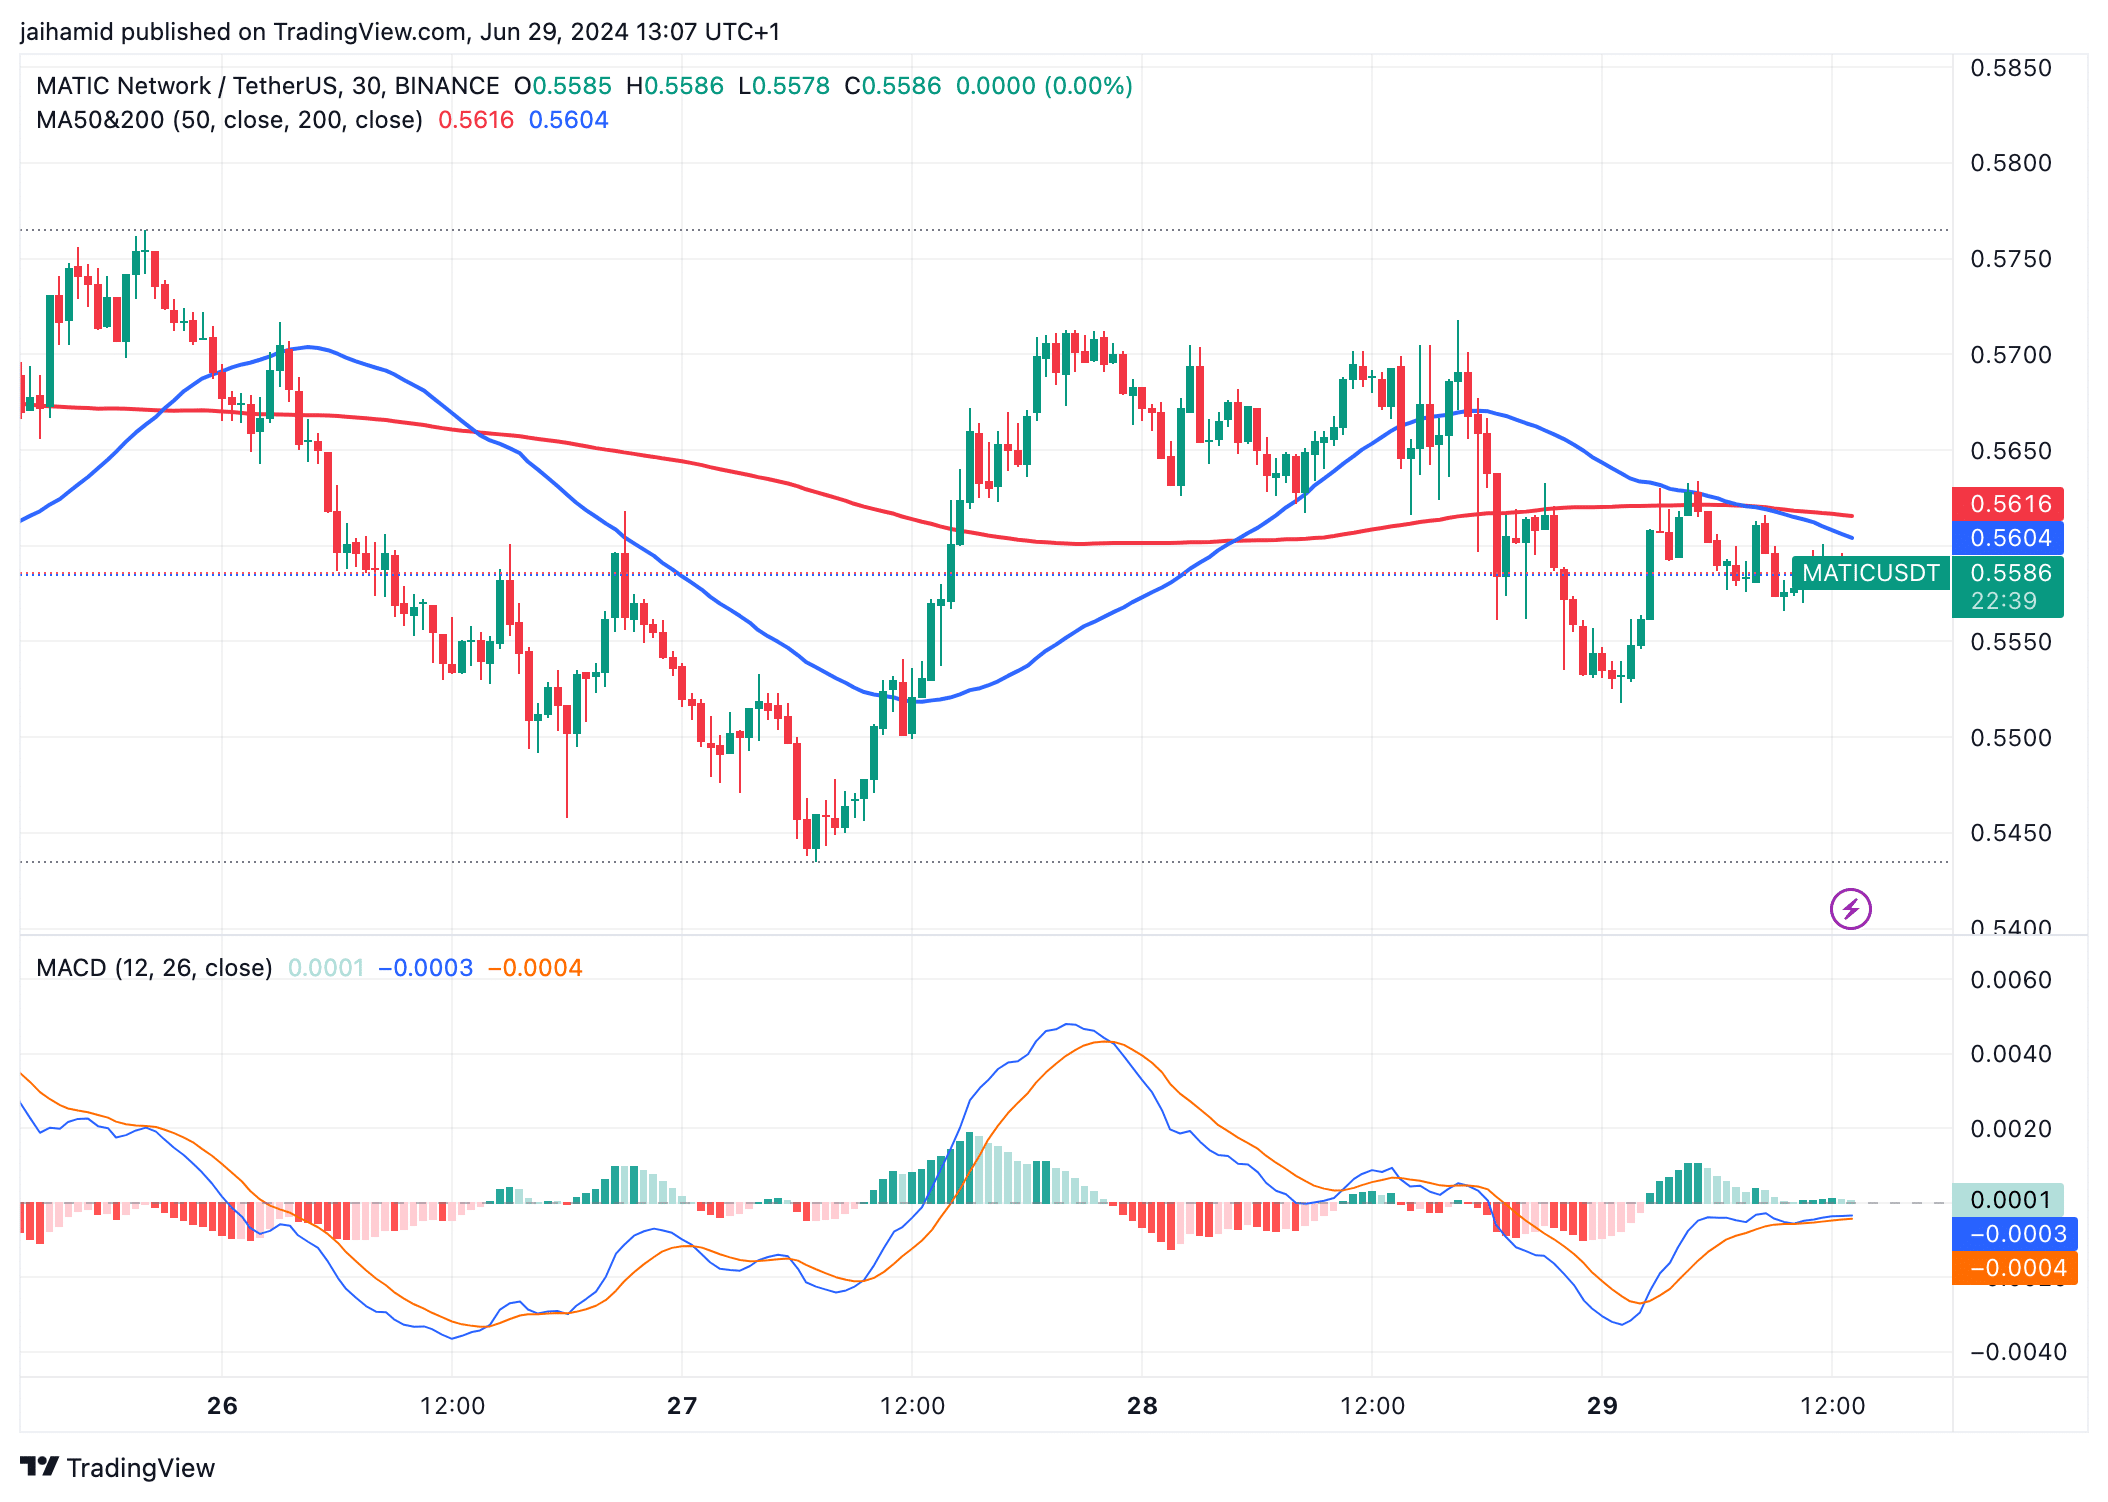
Polygon’s native token, MATIC, is in the news today after it hit a nine-month low on the charts. As expected, this has raised some concerns among investors and traders alike. And yet, despite said bearish sentiment, the Moving Average Convergence Divergence (MACD) seemed to suggest that a bullish reversal may soon be on the cards.
At the time of writing, the MACD line was hovering just below the Signal line, indicating bearish momentum on the charts. However, the proximity of the two lines meant that a bullish crossover may be imminent too.

Source: TradingView
At the same time, the price of MATIC was below both the 50 and 200-period MAs too – A sign of a bearish trend in the short term.
Together, this consolidation around its press time price levels, along with the MACD bullish crossover, tell us that buyers might be slowly gaining strength. This might be key to regenerating bullish strength in the altcoin’s market.
Market bears are still around
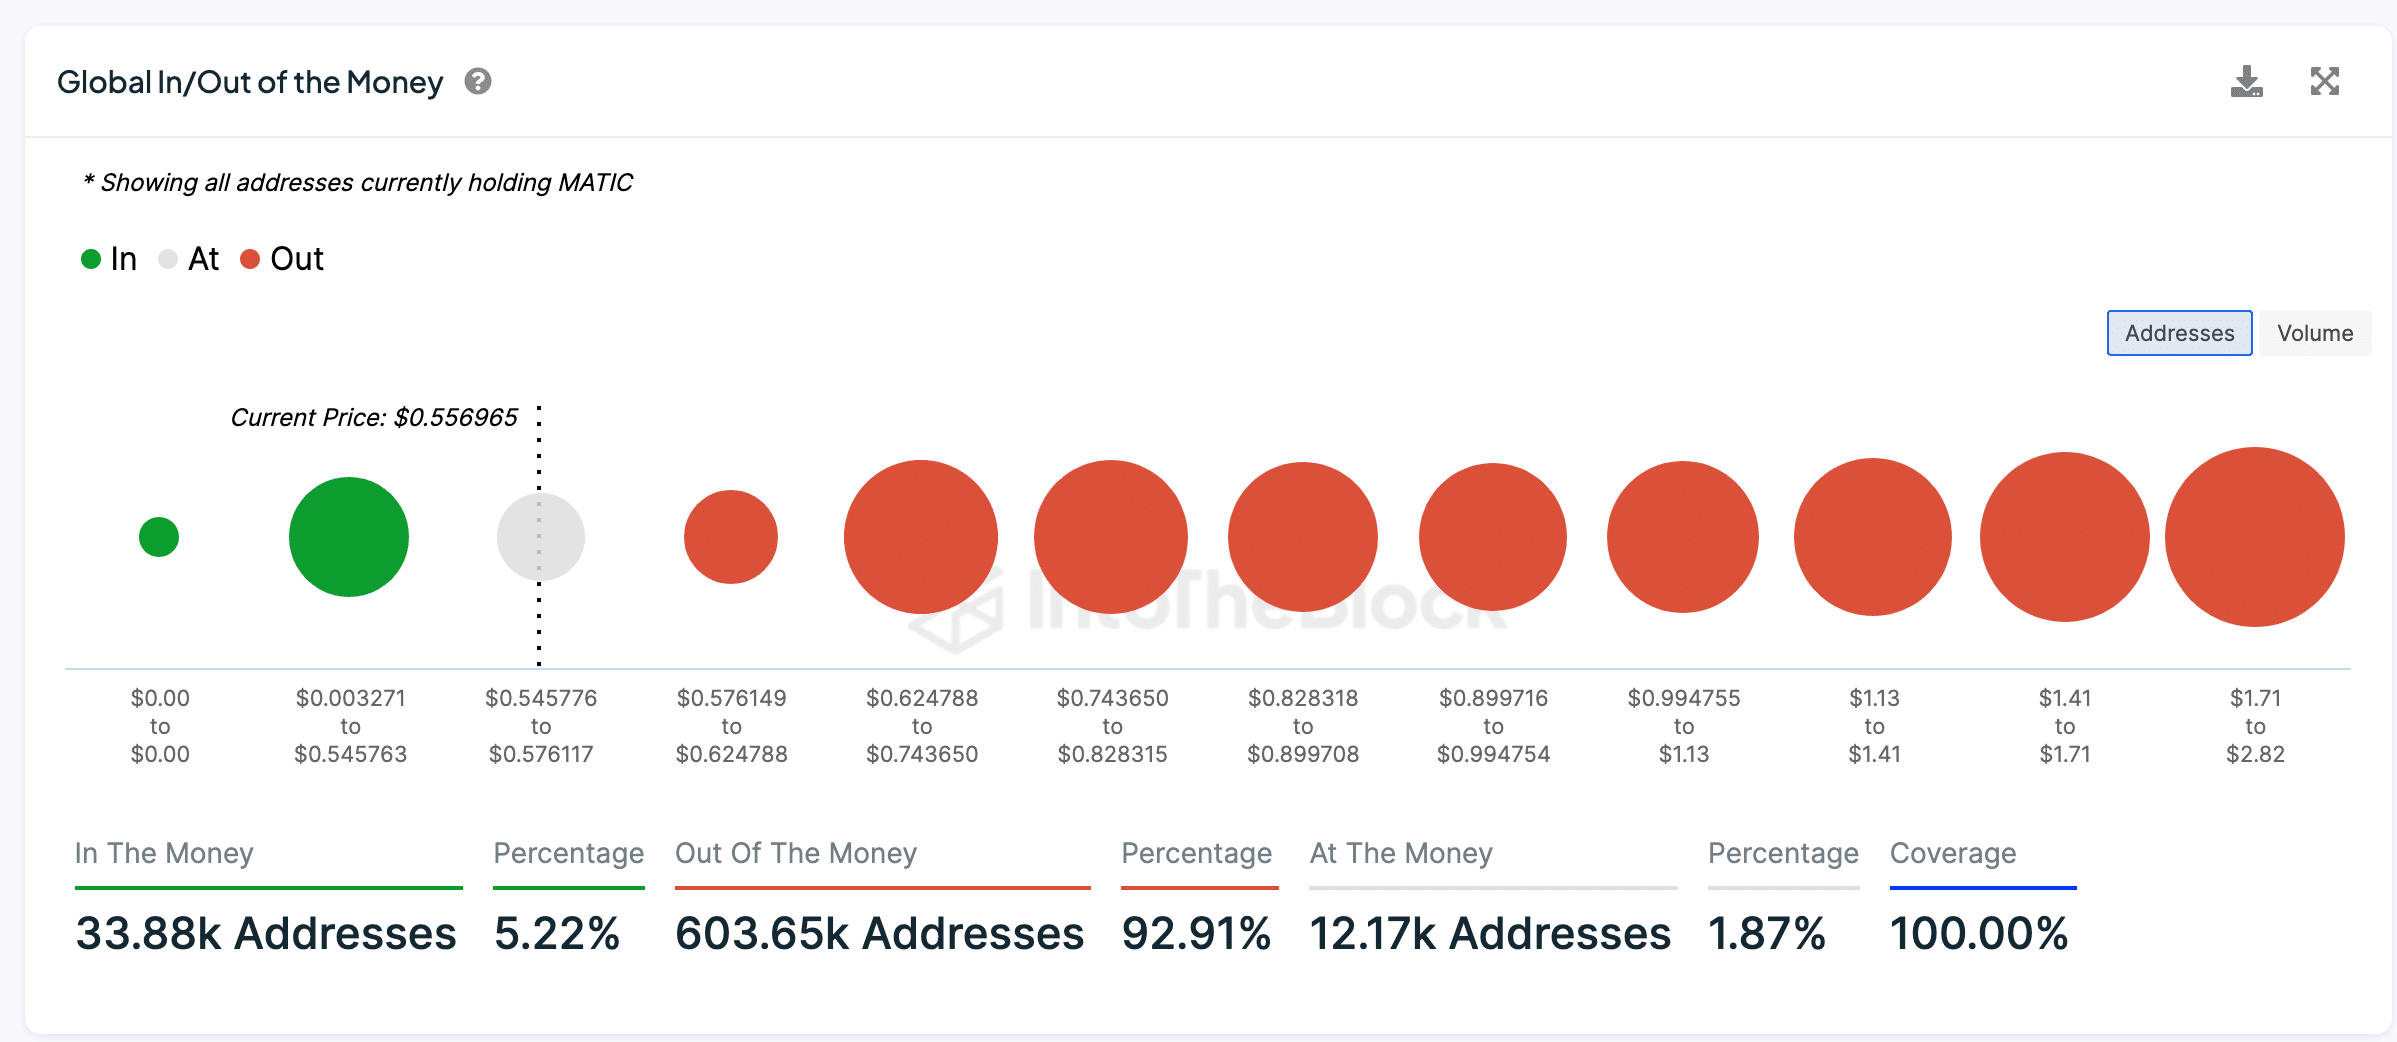
A majority (92.91%) of MATIC addresses are currently “out of the money,” meaning their holdings are now worth less than their purchase price. Conversely, only a small portion (5.22%) are “in the money.”


Source: IntoTheBlock
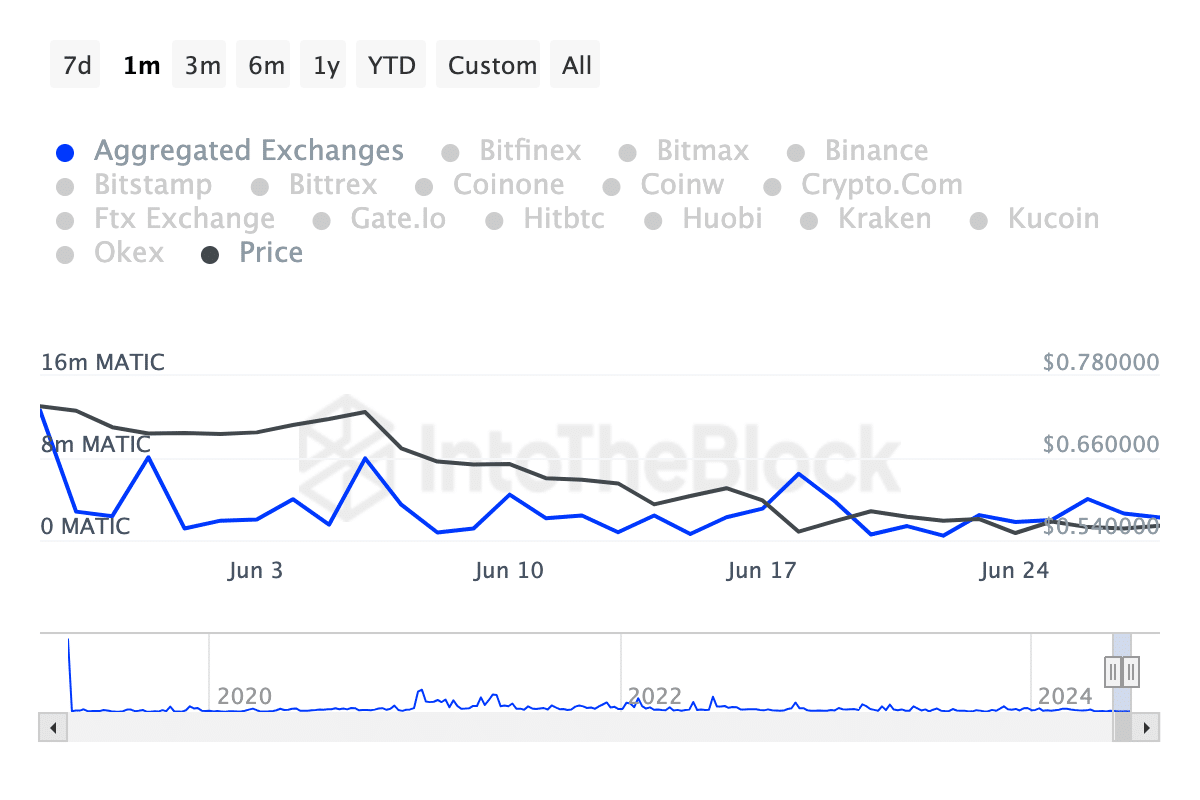
Inflow volumes across exchanges registered major spikes too – Typically a sign of selling pressure as investors transfer their tokens to exchanges, possibly to sell.
MATIC’s recent patterns, however, seemed to reveal a stable to decreasing trend in inflows. This means that the immediate selling pressure could be subsiding on the charts.


Source: IntoTheBlock
That being said, the data also indicated that outflows have been somewhat steady. Simply put, selling pressure hasn’t risen by a significant margin lately.
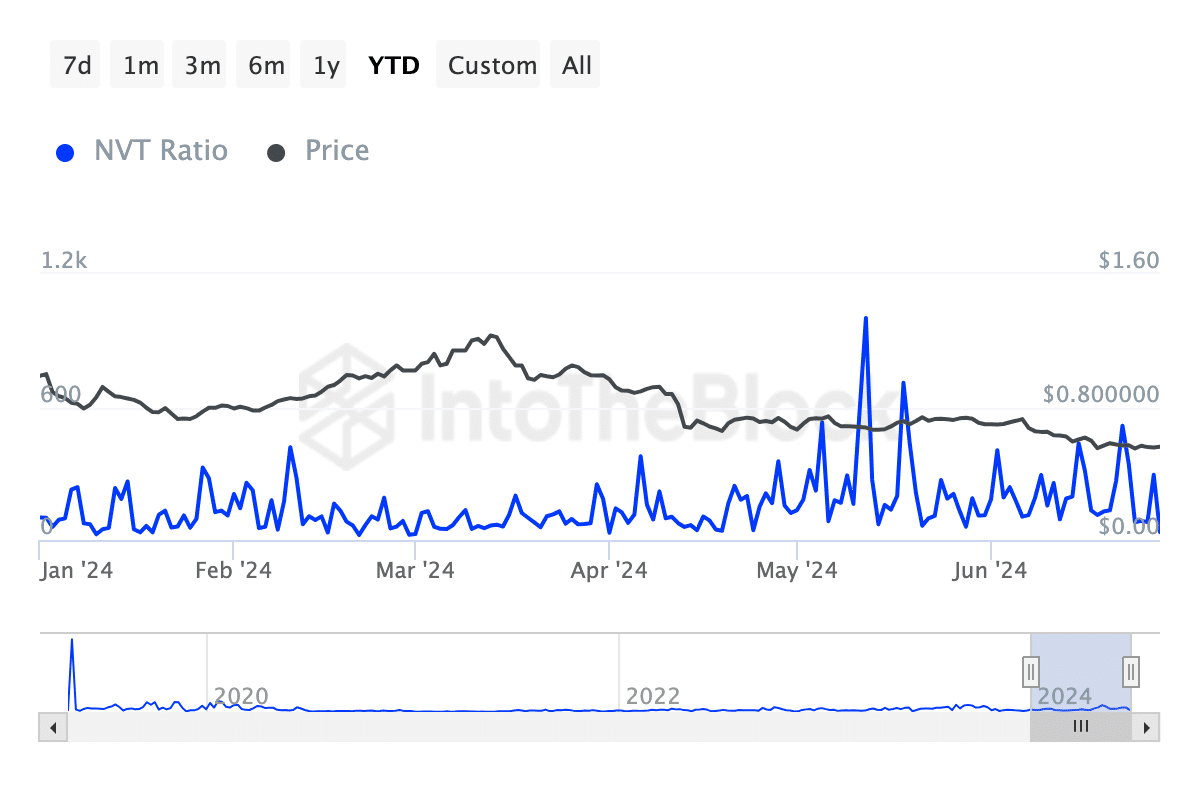
The NVT ratio flashed some fluctuations, but it was trending south on the charts. This implied that there was either a hike in transaction volume or a fall in network value. This can be seen as a bullish sign if the transaction volume hikes are sustainable.


Source: IntoTheBlock
Finally, there seemed to be a declining trend in whale transactions, showing reduced activity from major investors and less speculative trading at high volumes. This will reduce volatility in the short term.
For a bullish reversal to gain traction, market sentiment needs a massive bullish trigger that’s either network-related or related to wider economic trends.

