
- SUI’s latest uptrend has allowed it to reverse some of its recent gains
- Altcoin’s next ATH will depend on a few key factors turning it around
After hitting its all-time high (ATH) of $5.36 on 6 January, SUI shed over 30% of its value over the past month. However, its latest rebound above the 200-day Exponential Moving Average (EMA) triggered an 11% jump over the last three days, outperforming many cryptos during the broader market’s downtrend.
With a short-term breakout from its descending channel, traders are now eager to see if SUI can push past its near-term barriers or not.
Bulls eye the 20/50 EMA resistance
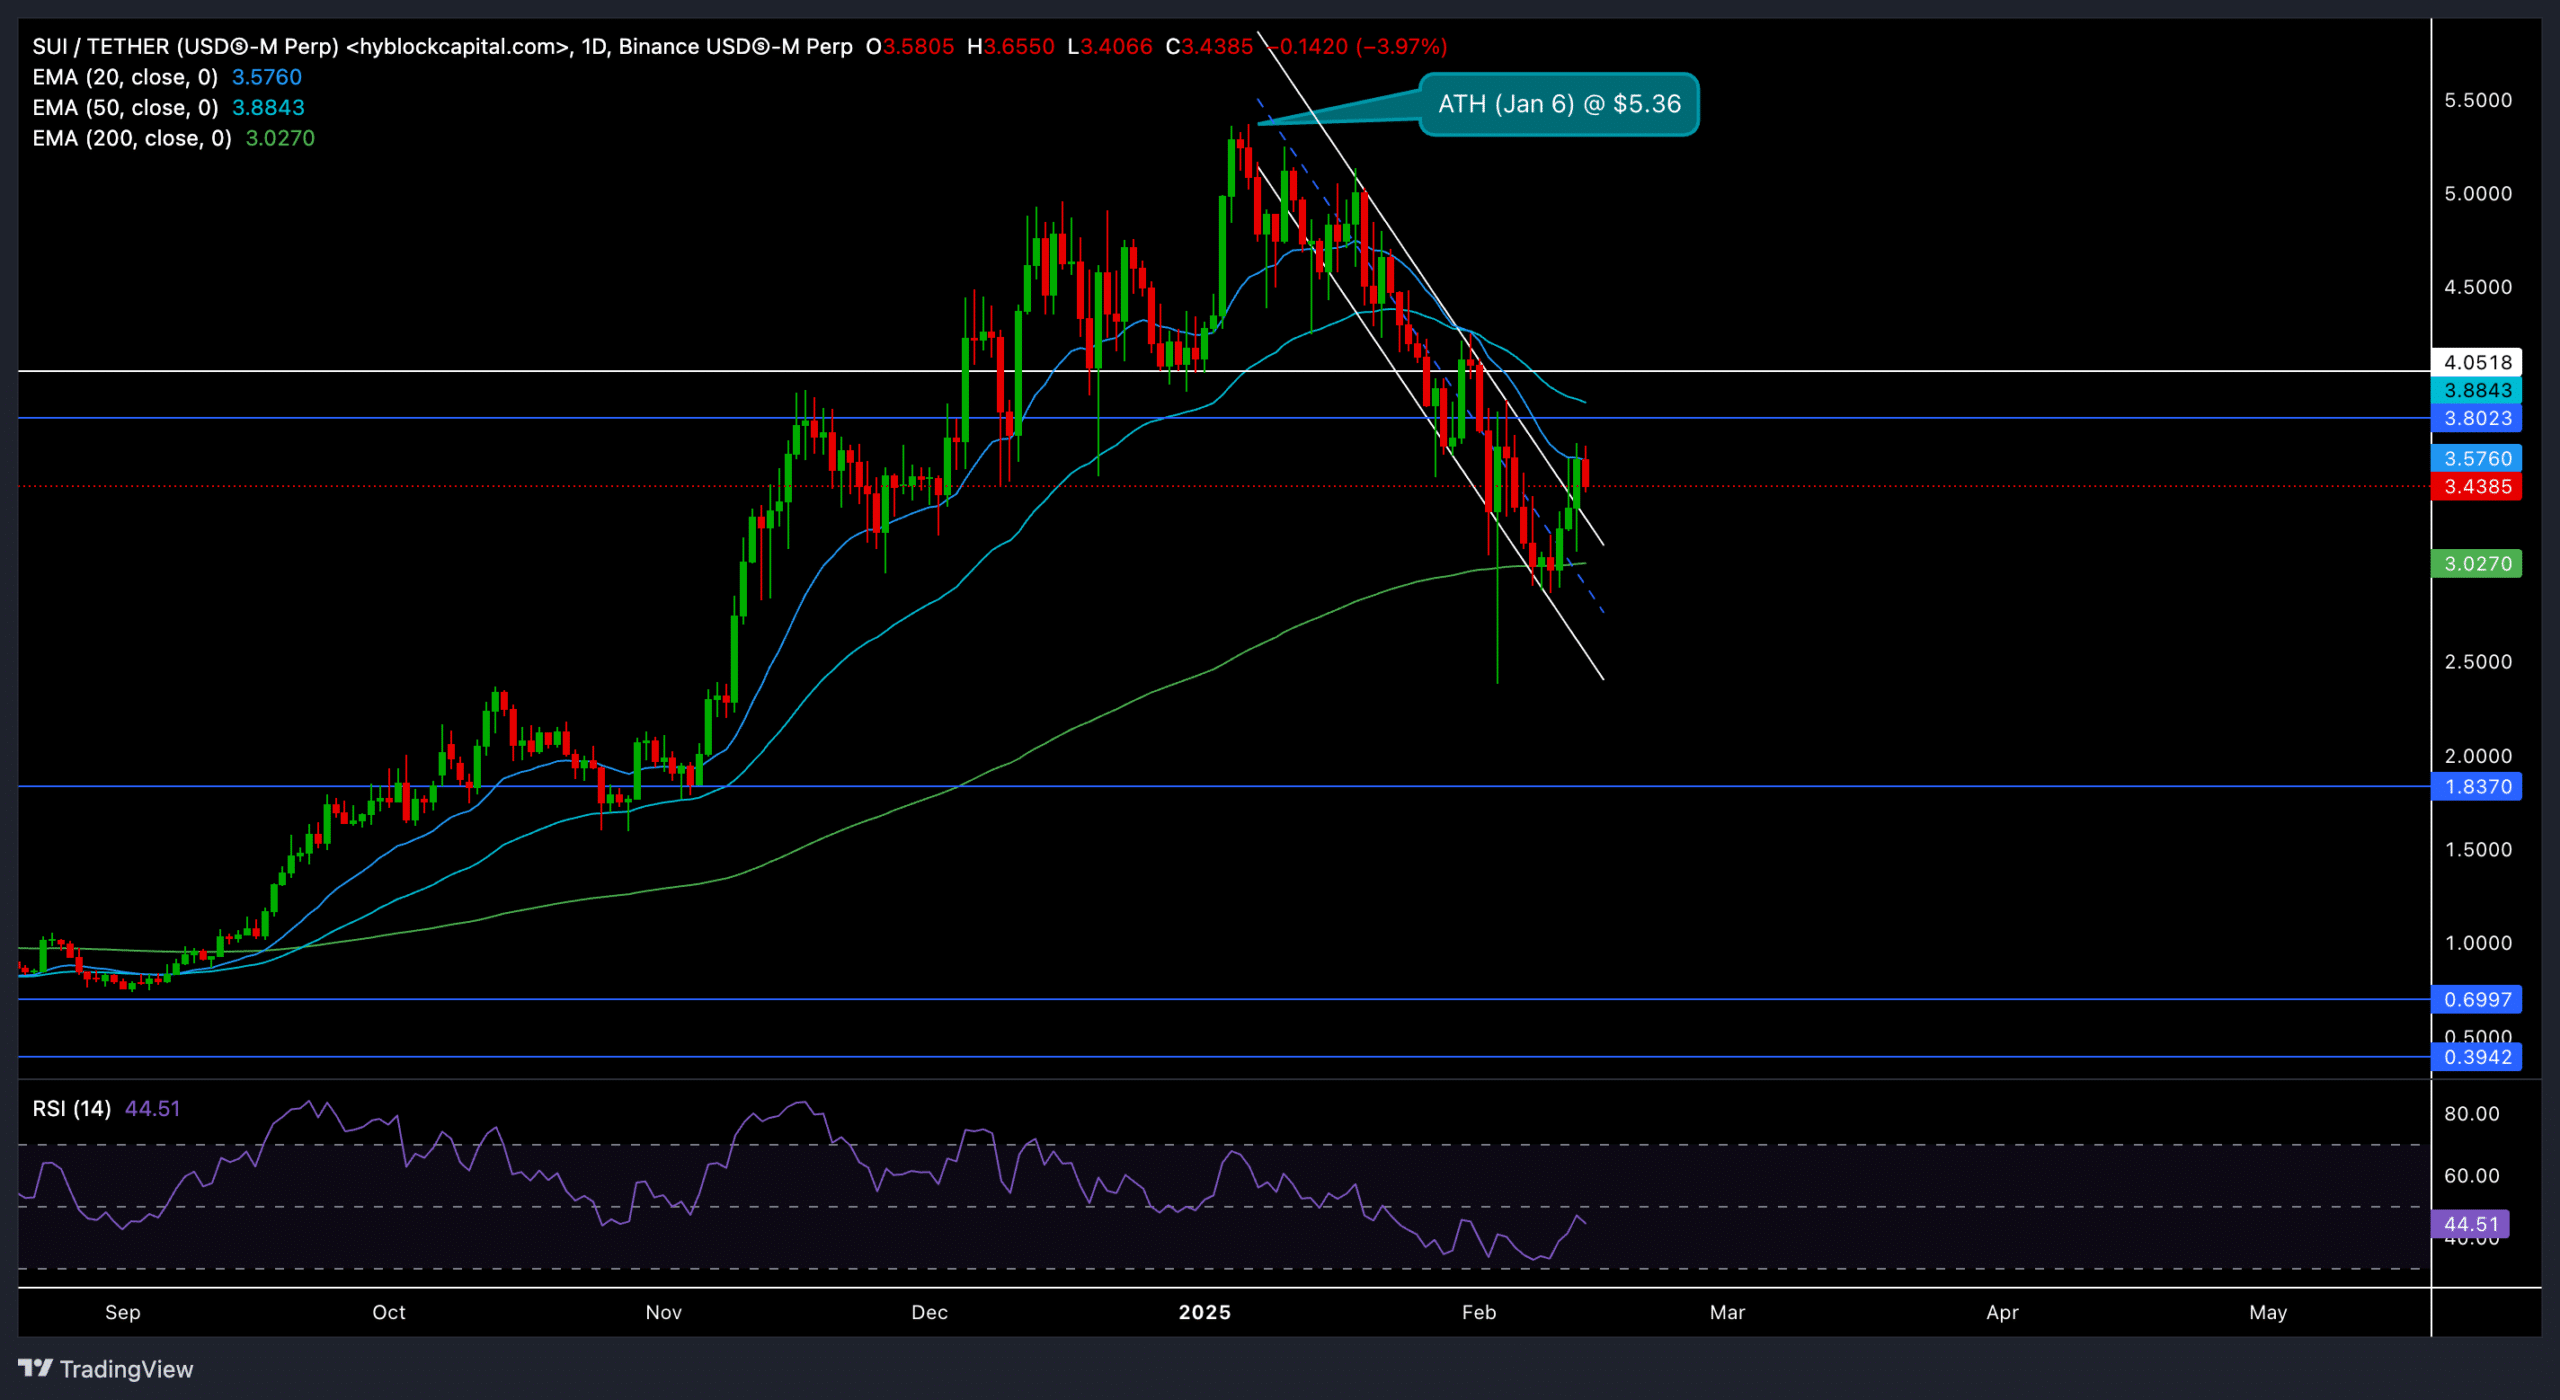
Source: TradingView, SUI/USDT
SUI’s slump from the $5.36 ATH found support near the $3 zone (around the 200-day EMA). This cushioned the downtrend and paved the way for an 11% hike over the last few days.
Now, the 20-day and 50-day EMAs (near the $3.57–$3.88 range) stand in the way of a stronger bullish resurgence. A daily close above the 20/50 EMA around the $4-mark could signal a stronger recovery attempt towards the $4.05–$4.50 region.
If buyers fail to push above the EMAs, traders can expect sustained consolidation or a mild pullback near the 200-day EMA at $3. Especially if broader market sentiment remains shaky. If broader market sentiment worsens, a drop towards the $2.80–$2.50 support region can’t be ruled out.
Meanwhile, the Relative Strength Index (RSI) on the daily timeframe hovered around 44 – Hinting at a slight bearish edge. A decisive move above the 50 level on the RSI would confirm increasing buying pressure.
Derivatives data shows THIS

Source: Hyblockcapital
Volume rose by around 9.37% to $2.56 billion to indicate renewed trader interest. Open Interest climbed by around 6.8%, showing how fresh capital entered SUI’s Futures market.
At the time of writing, the 24-hour long/short overall ratio stood near 1 and was almost evenly split. However, Binance’s SUI/USDT ratio was more bullish at 2.07.
Interestingly, in the 1-hour and 12-hour “Rekt” stats, long liquidations outweighed shorts. More long liquidations indicate that traders who anticipated a rise in SUI’s price were taken aback by a price decline.
Despite this short-term turbulence, however, the uptick in Open Interest revealed the potential for bigger moves ahead as buyers and sellers positioned themselves.
As always, keeping a close eye on Bitcoin’s momentum and the overall crypto market cues can help traders gauge SUI’s near-term trajectory. While SUI’s fundamentals still paint a positive long-term story, the next few days are crucial for short-term traders looking to capitalize on volatility.
Disclaimer: The information presented does not constitute financial, investment, trading, or other types of advice and is solely the writer’s opinion