- Net Fed liquidity drop expected in 2nd half of September
- Bitcoin’s price recovery can be expected in October
Bitcoin [BTC] is facing significant market shifts, largely due to an anticipated Net Fed Liquidity drop that is predicted for the second half of September.
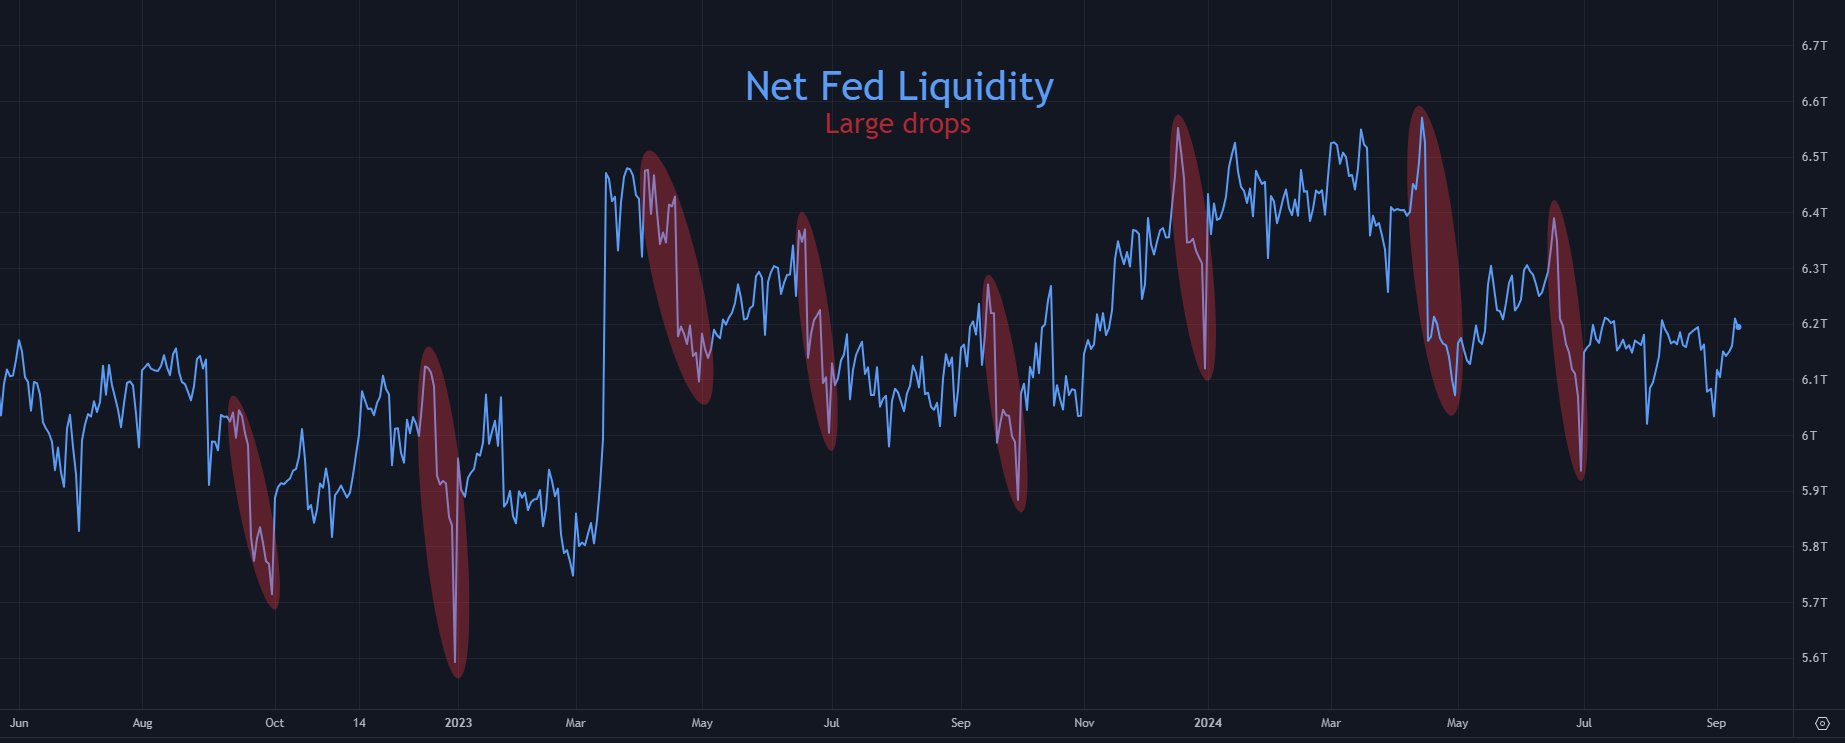
In fact, popular analyst Tomas expects a liquidity drain of around $300 billion to $550 billion. This can affect risk assets like Bitcoin, gold, and the S&P 500.
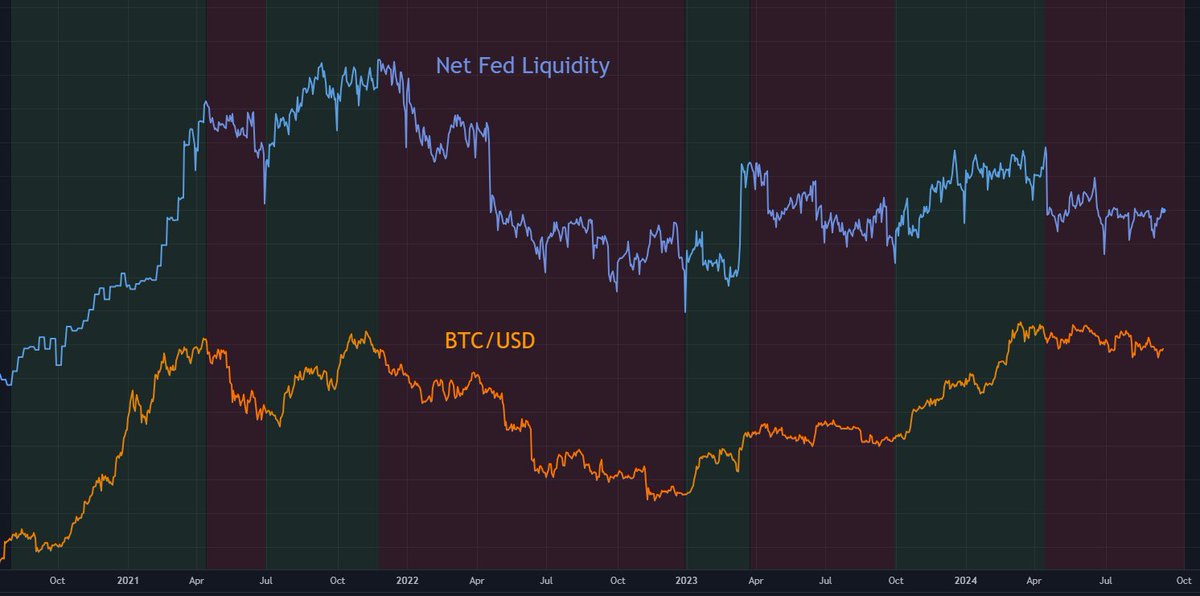
While this correlation between Net Fed Liquidity and Bitcoin has remained strong for four years, it could change at any time.
Historically, these liquidity drops have negatively affected Bitcoin, pushing the price lower on the charts. However, a partial reversal can be expected on 1 October, offering hope for a potential recovery.
Source: Tomas/X
From September 2022 to August 2024, Bitcoin’s average daily performance was positive at +0.26%.
However, during “large Fed Liquidity drops,” this performance dipped to -0.13%, underlining the effect of reduced liquidity on BTC’s price.
While Bitcoin has shown resilience during certain liquidity drops, it tends to follow the medium-term trends of Net Fed Liquidity.
Since 2020, for instance, BTC/USD has either remained flat or declined during liquidity downtrends. It only gained strength during uptrends.

Source: Tomas/X
This pattern is expected to continue unless the Federal Reserve stops its current Quantitative Tightening (QT).
The next update on QT may come at the FOMC meeting on 18 September. This might give us more insights into future liquidity trends and their impact on Bitcoin’s price.
What do the price charts say?
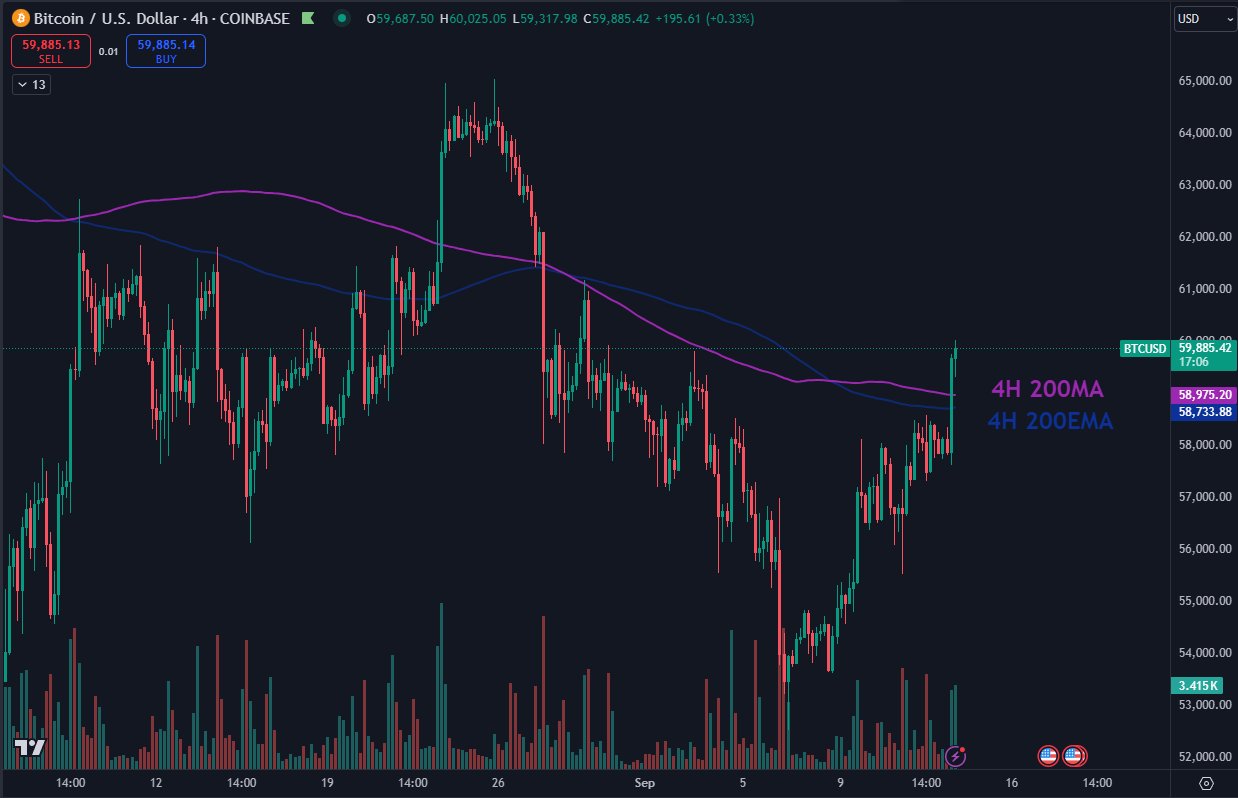
Bitcoin’s price recently broke above the 4-hour 200 exponential moving average (EMA). At press time, the crypto was trading at $60k after bouncing back from the $52k support level.
This flip of the 200EMA indicates that BTC may be set for higher prices in the short and mid-term. Especially as the market shows signs of momentum and strength.
If Bitcoin can maintain this level, the bounce will continue into October. This will be the case even as the liquidity reversal approaches.

Source: TradingView
Bitcoin’s supply divergence
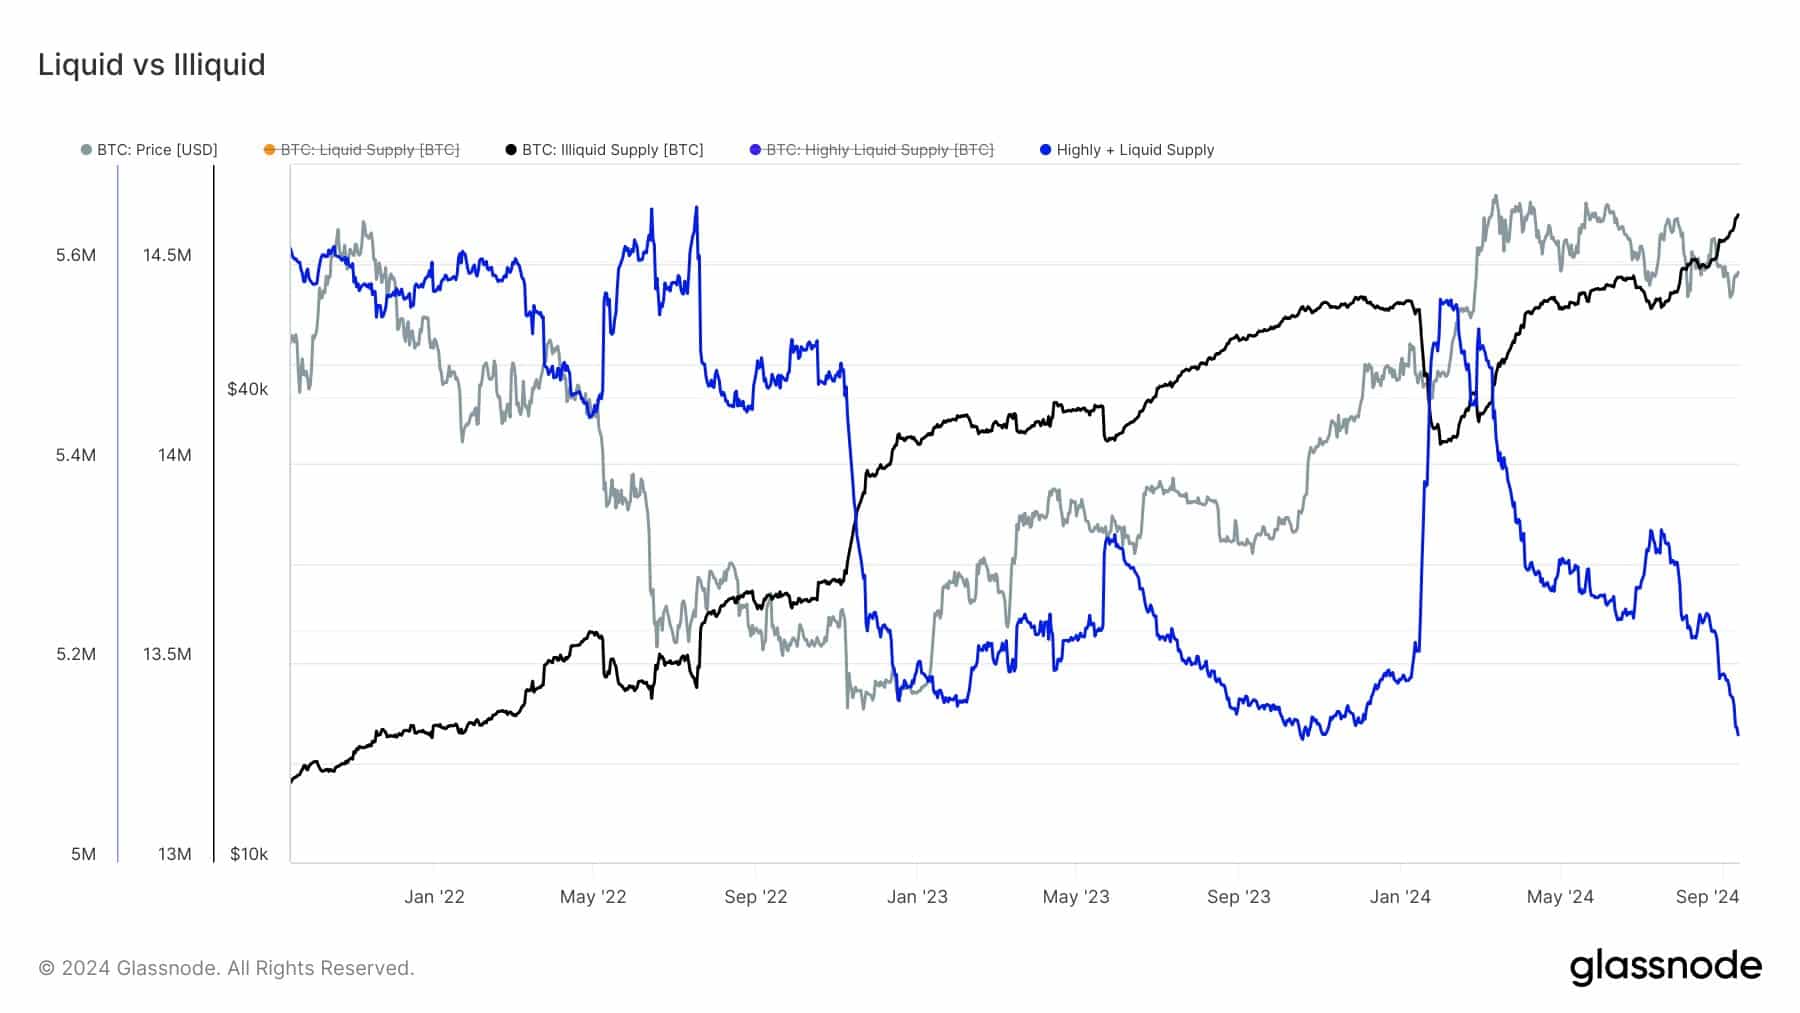
Additionally, the supply dynamics for Bitcoin also highlighted a key divergence. At press time, Bitcoin’s circulating supply stood at around 19.8M, with illiquid supply accounting for 14.6M BTC or 73%.
Illiquid supply refers to Bitcoin held by entities that rarely trade or move it, making it unavailable for market transactions.
This rising illiquid supply reduces overall liquidity in the market. On the other hand, liquid and highly liquid supply amounted to 5.2 million BTC, actively traded and readily available.
This imbalance between illiquid and liquid supply adds another layer to Bitcoin’s price movements.

Source: Glassnode
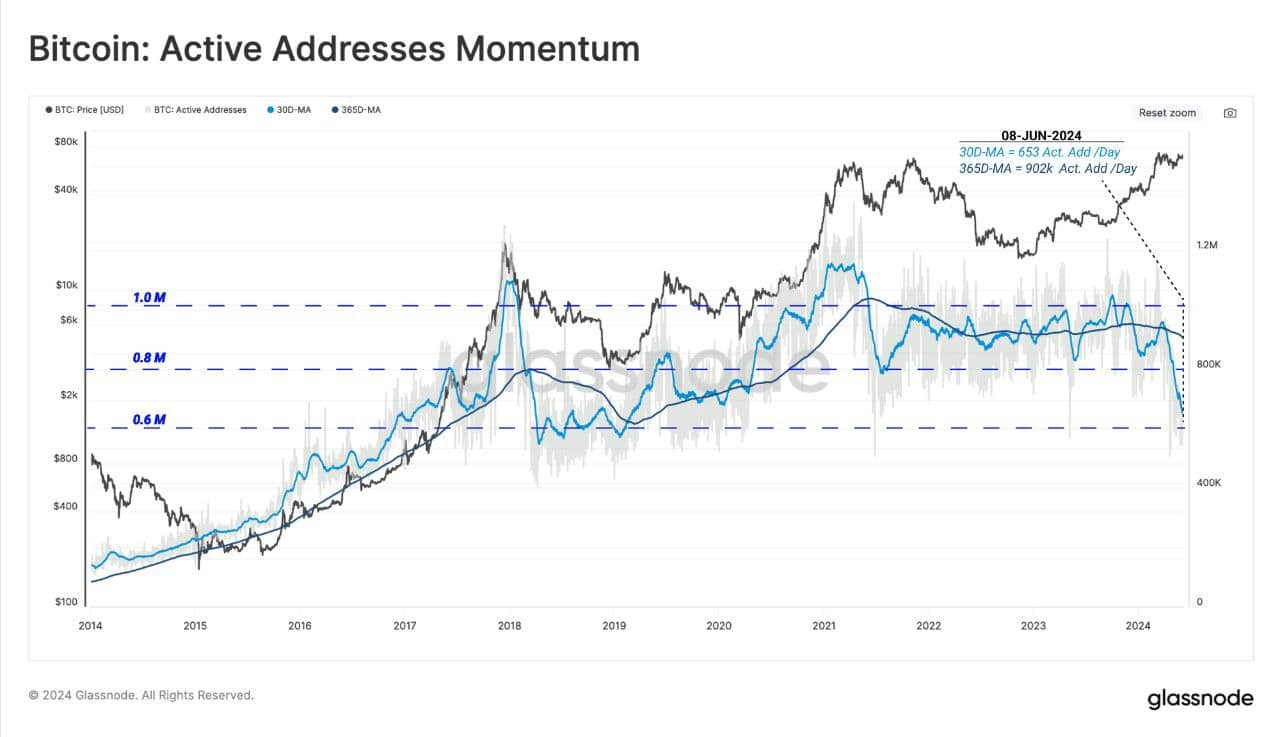
Active addresses momentum
Finally, while Bitcoin’s transaction count is at an all-time high, active addresses have sharply declined. This divergence is contrary to prior bullish periods during which both transactions and active users have typically risen together.
Simply put, despite the rising price and strong market momentum, fewer users are now actively participating in Bitcoin transactions.

Source: Glassnode
According to Glassnode, this divergence is a sign of a change in market behavior, one that could affect Bitcoin’s price in the coming months.
Overall, Bitcoin’s price looks poised for a potential move higher. However, liquidity trends and supply dynamics will continue to play a critical role.

