- A sustained bull rally might allow Aptos to retest its March highs
- Metrics showed that APT whales have been receiving more exposure in the market
Aptos [APT] has performed very well over the last seven days, with the altcoin registering double-digit growth. Thanks to the same, the token even managed to break above a multi-month bullish pattern, a breakout which could soon result in APT doubling its price.
Aptos breaks above a pattern
According to CoinMarketCap, Aptos bulls pushed the token’s price up by more than 20% in the last seven days. The bullish trend continued in the last 24 hours too as APT’s value hiked by over 7%. At the time of writing, APT was trading at $7.11 with a market capitalization of over $3.44 billion.
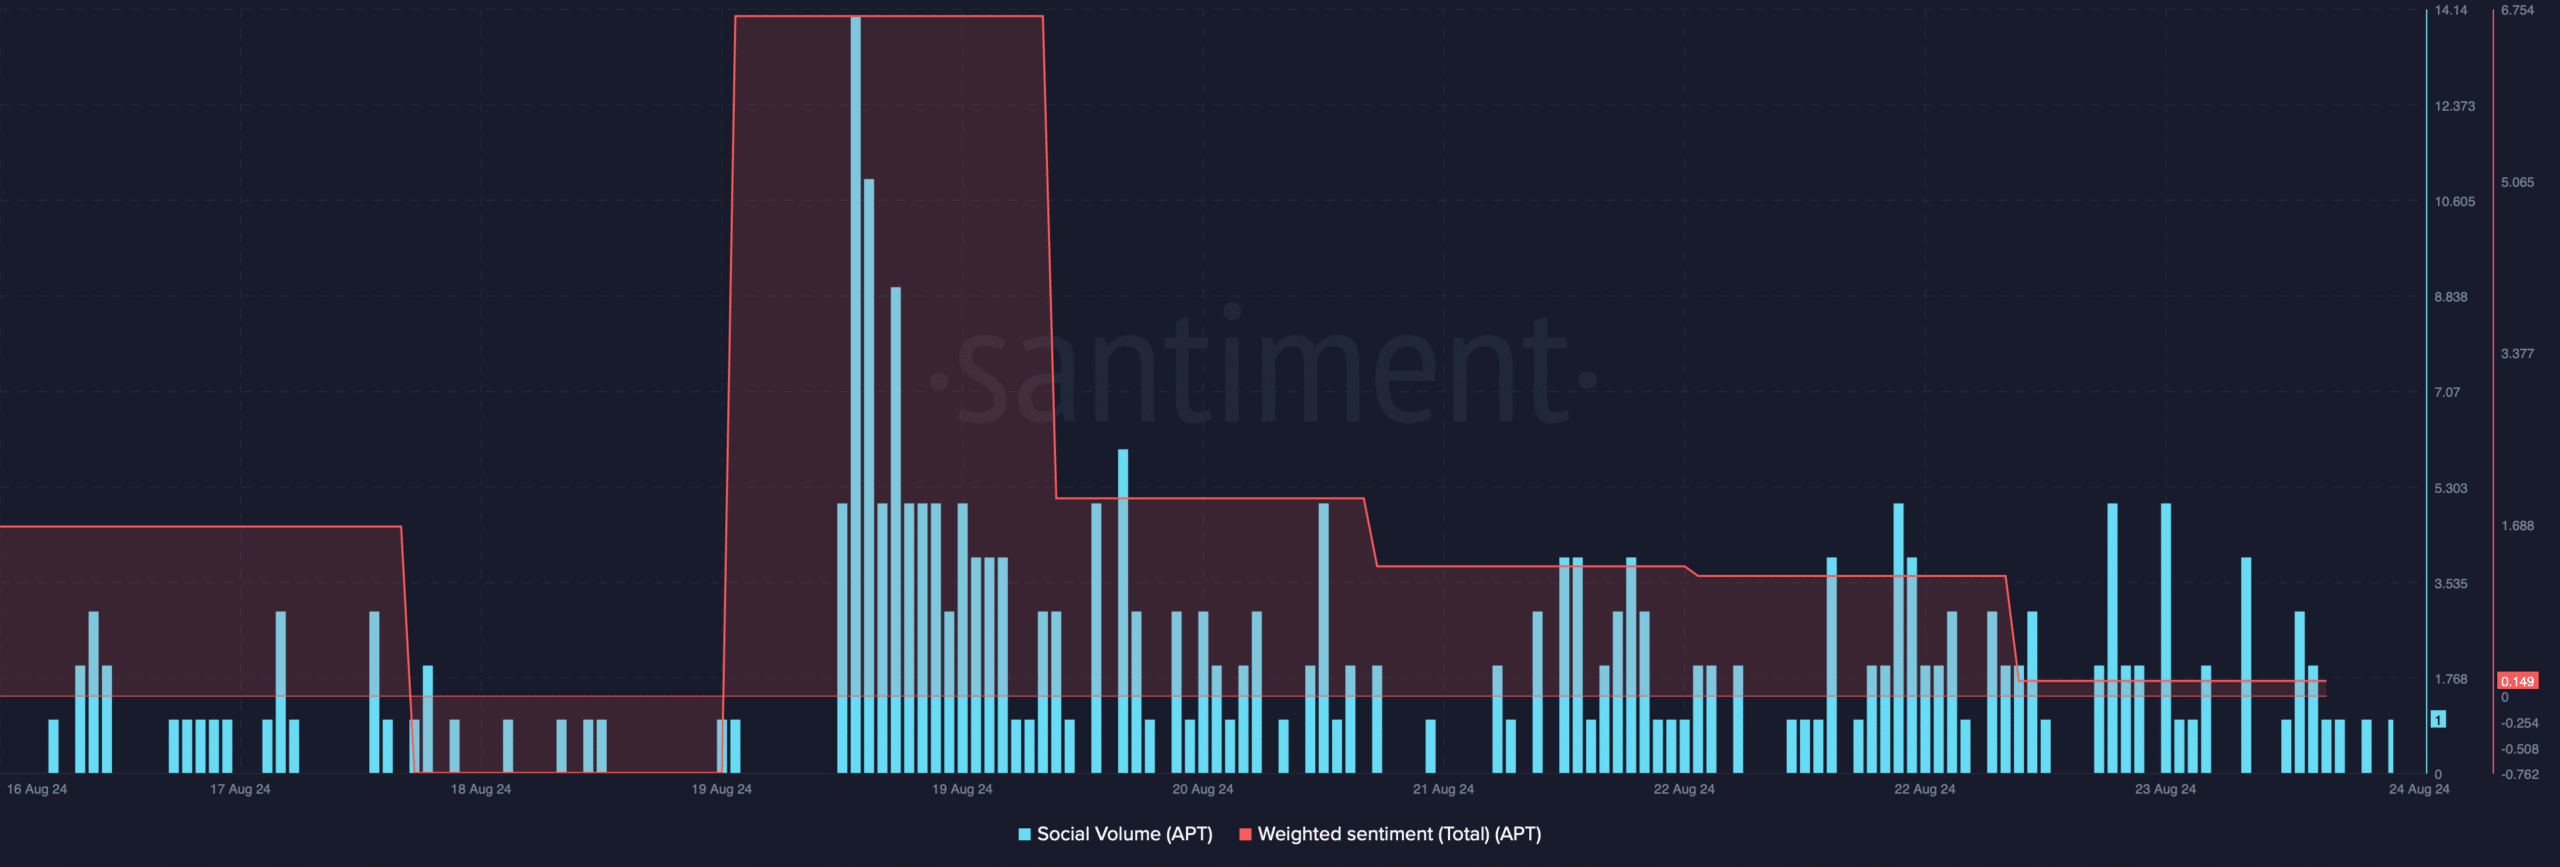
Surprisingly, despite the latest price hike, Aptos’ weighted sentiment declined. This suggested that bearish sentiment around the token has been rising. Its social volume also fell, underlining a drop in the altcoin’s popularity.
Source: Santiment
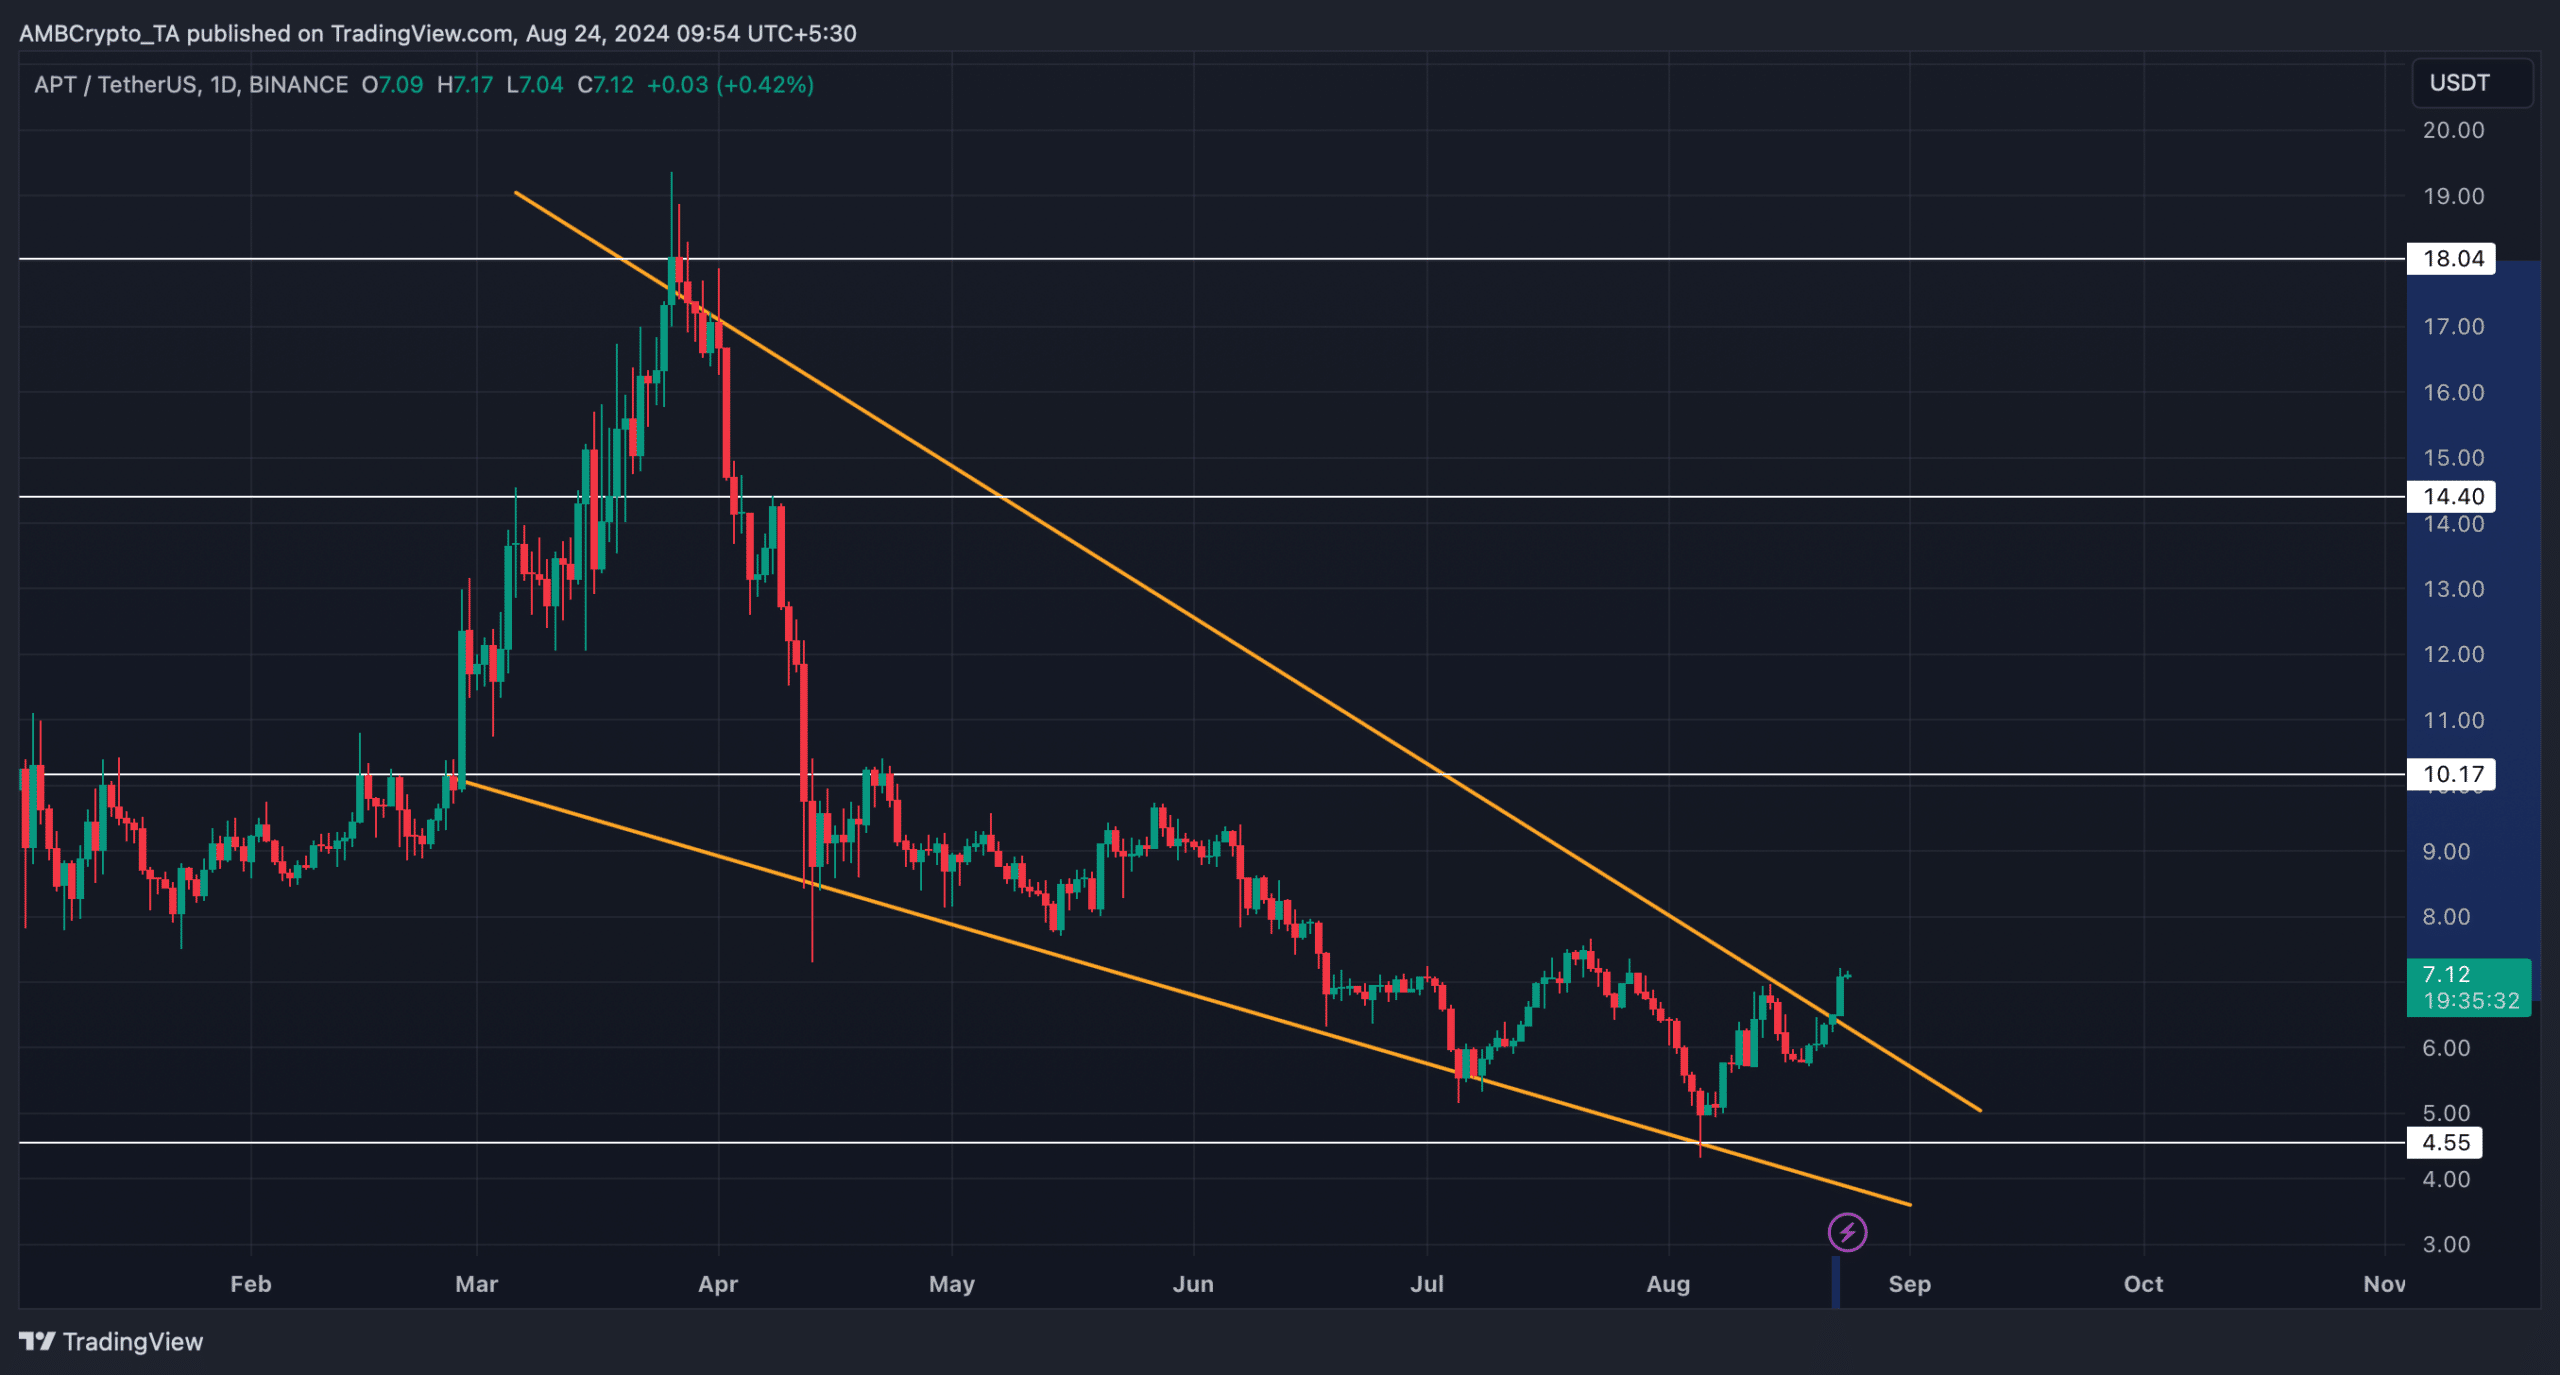
While that happened, the token broke above a bullish falling wedge pattern. The pattern appeared in March, and APT’s price consolidated inside it, only to break out a few days ago.
This breakout indicated that APT might see 2x growth and retest its March highs soon. However, before targeting its March highs, the token has to first jump above its resistance levels at $10.17 and $14.4 in the coming weeks.

Source: TradingView
Will APT’s bull rally continue?
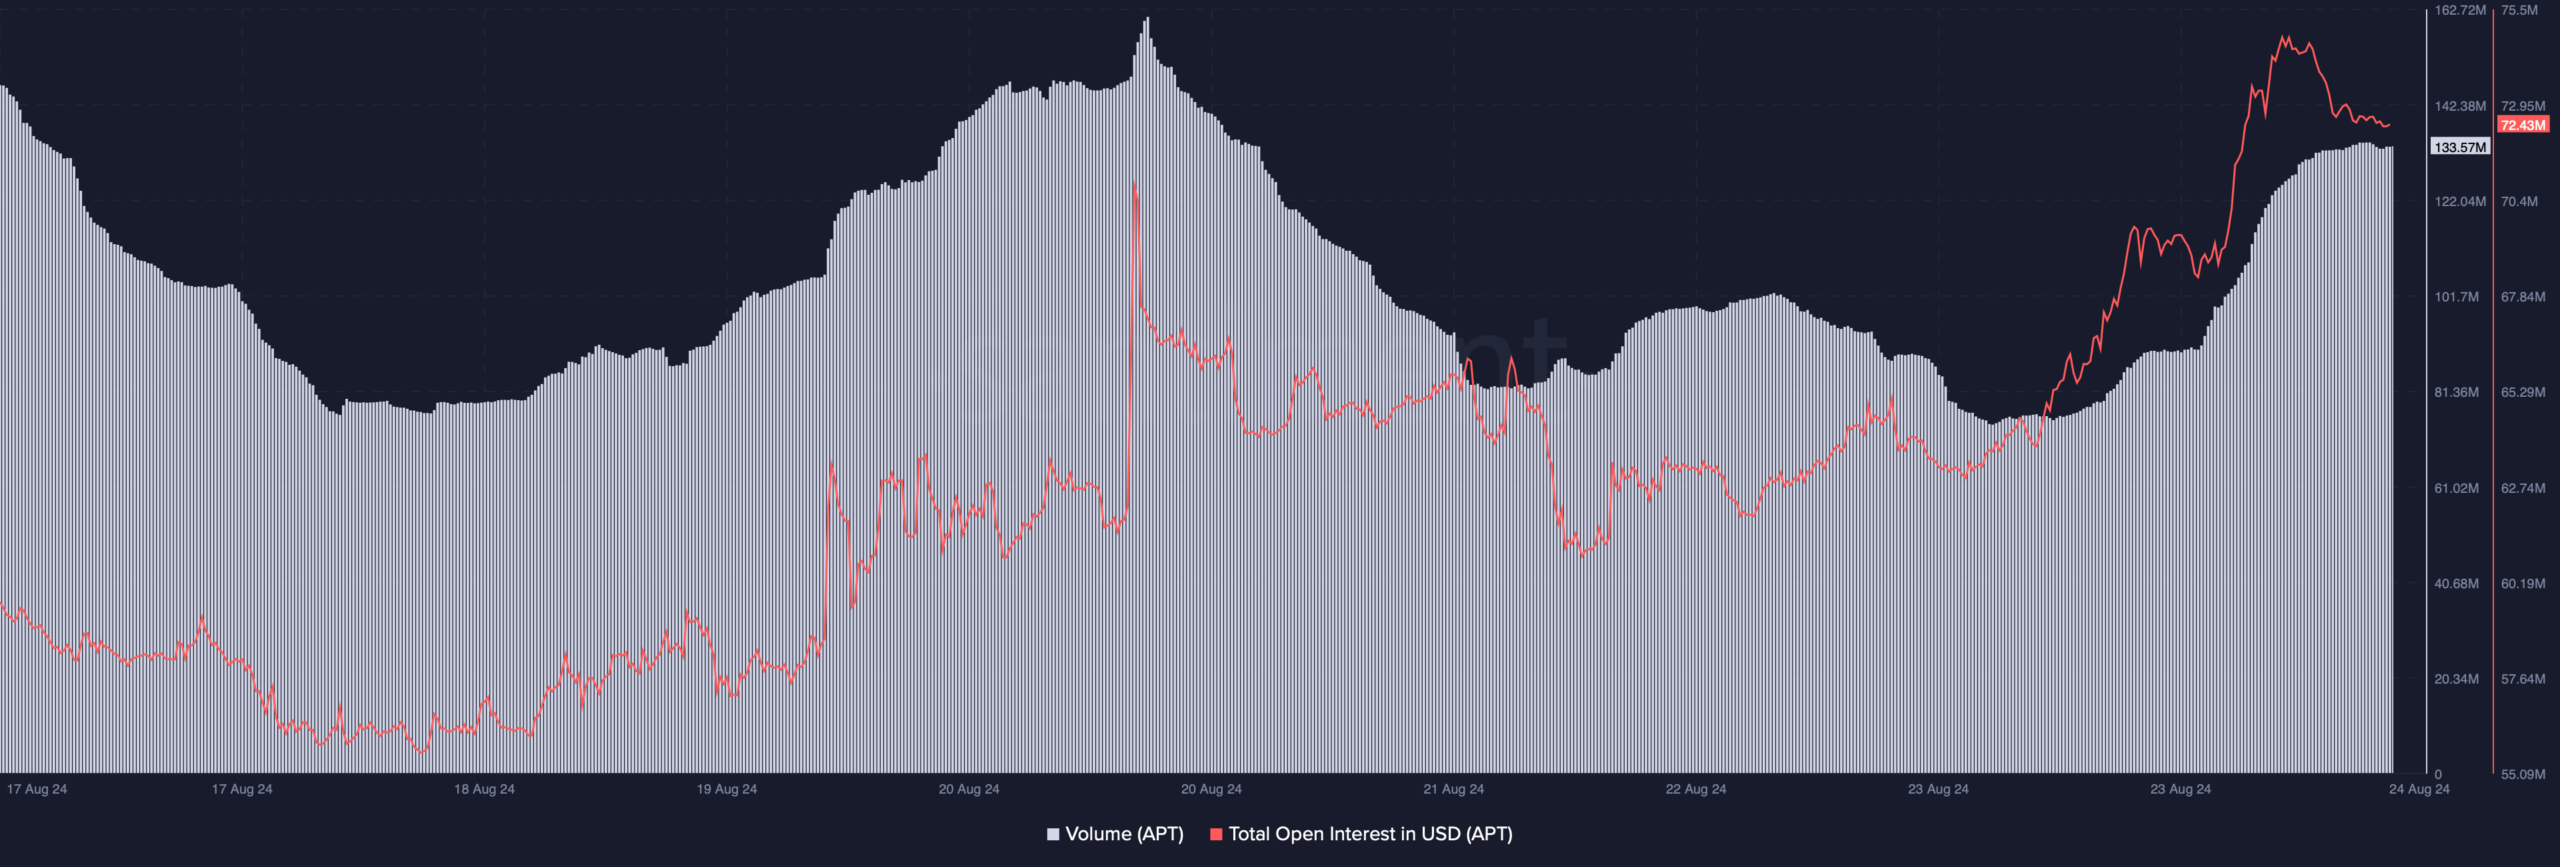
AMBCrypto then took a look at Aptos’ on-chain data to find out what they suggested regarding a sustained price rise. We found that APT’s trading volume surged by 71%, which generally acts as a foundation for a bull run.
The token’s Open Interest increased along with its price. A hike in this metric indicated that the chances of the ongoing price trend continuing are high.

Source: Santiment
Additionally, Coinglass’ data revealed that APT’s long/short ratio rose too.
This meant that there were more long positions in the market than short positions, which looked bullish. Also, as per Hyblock Capital’s data, Aptos’ whale vs retail delta had a value of 54 at press time. A number closer between 0 and 100 indicates that whales have been having more exposure.


Source: Hyblock Capital
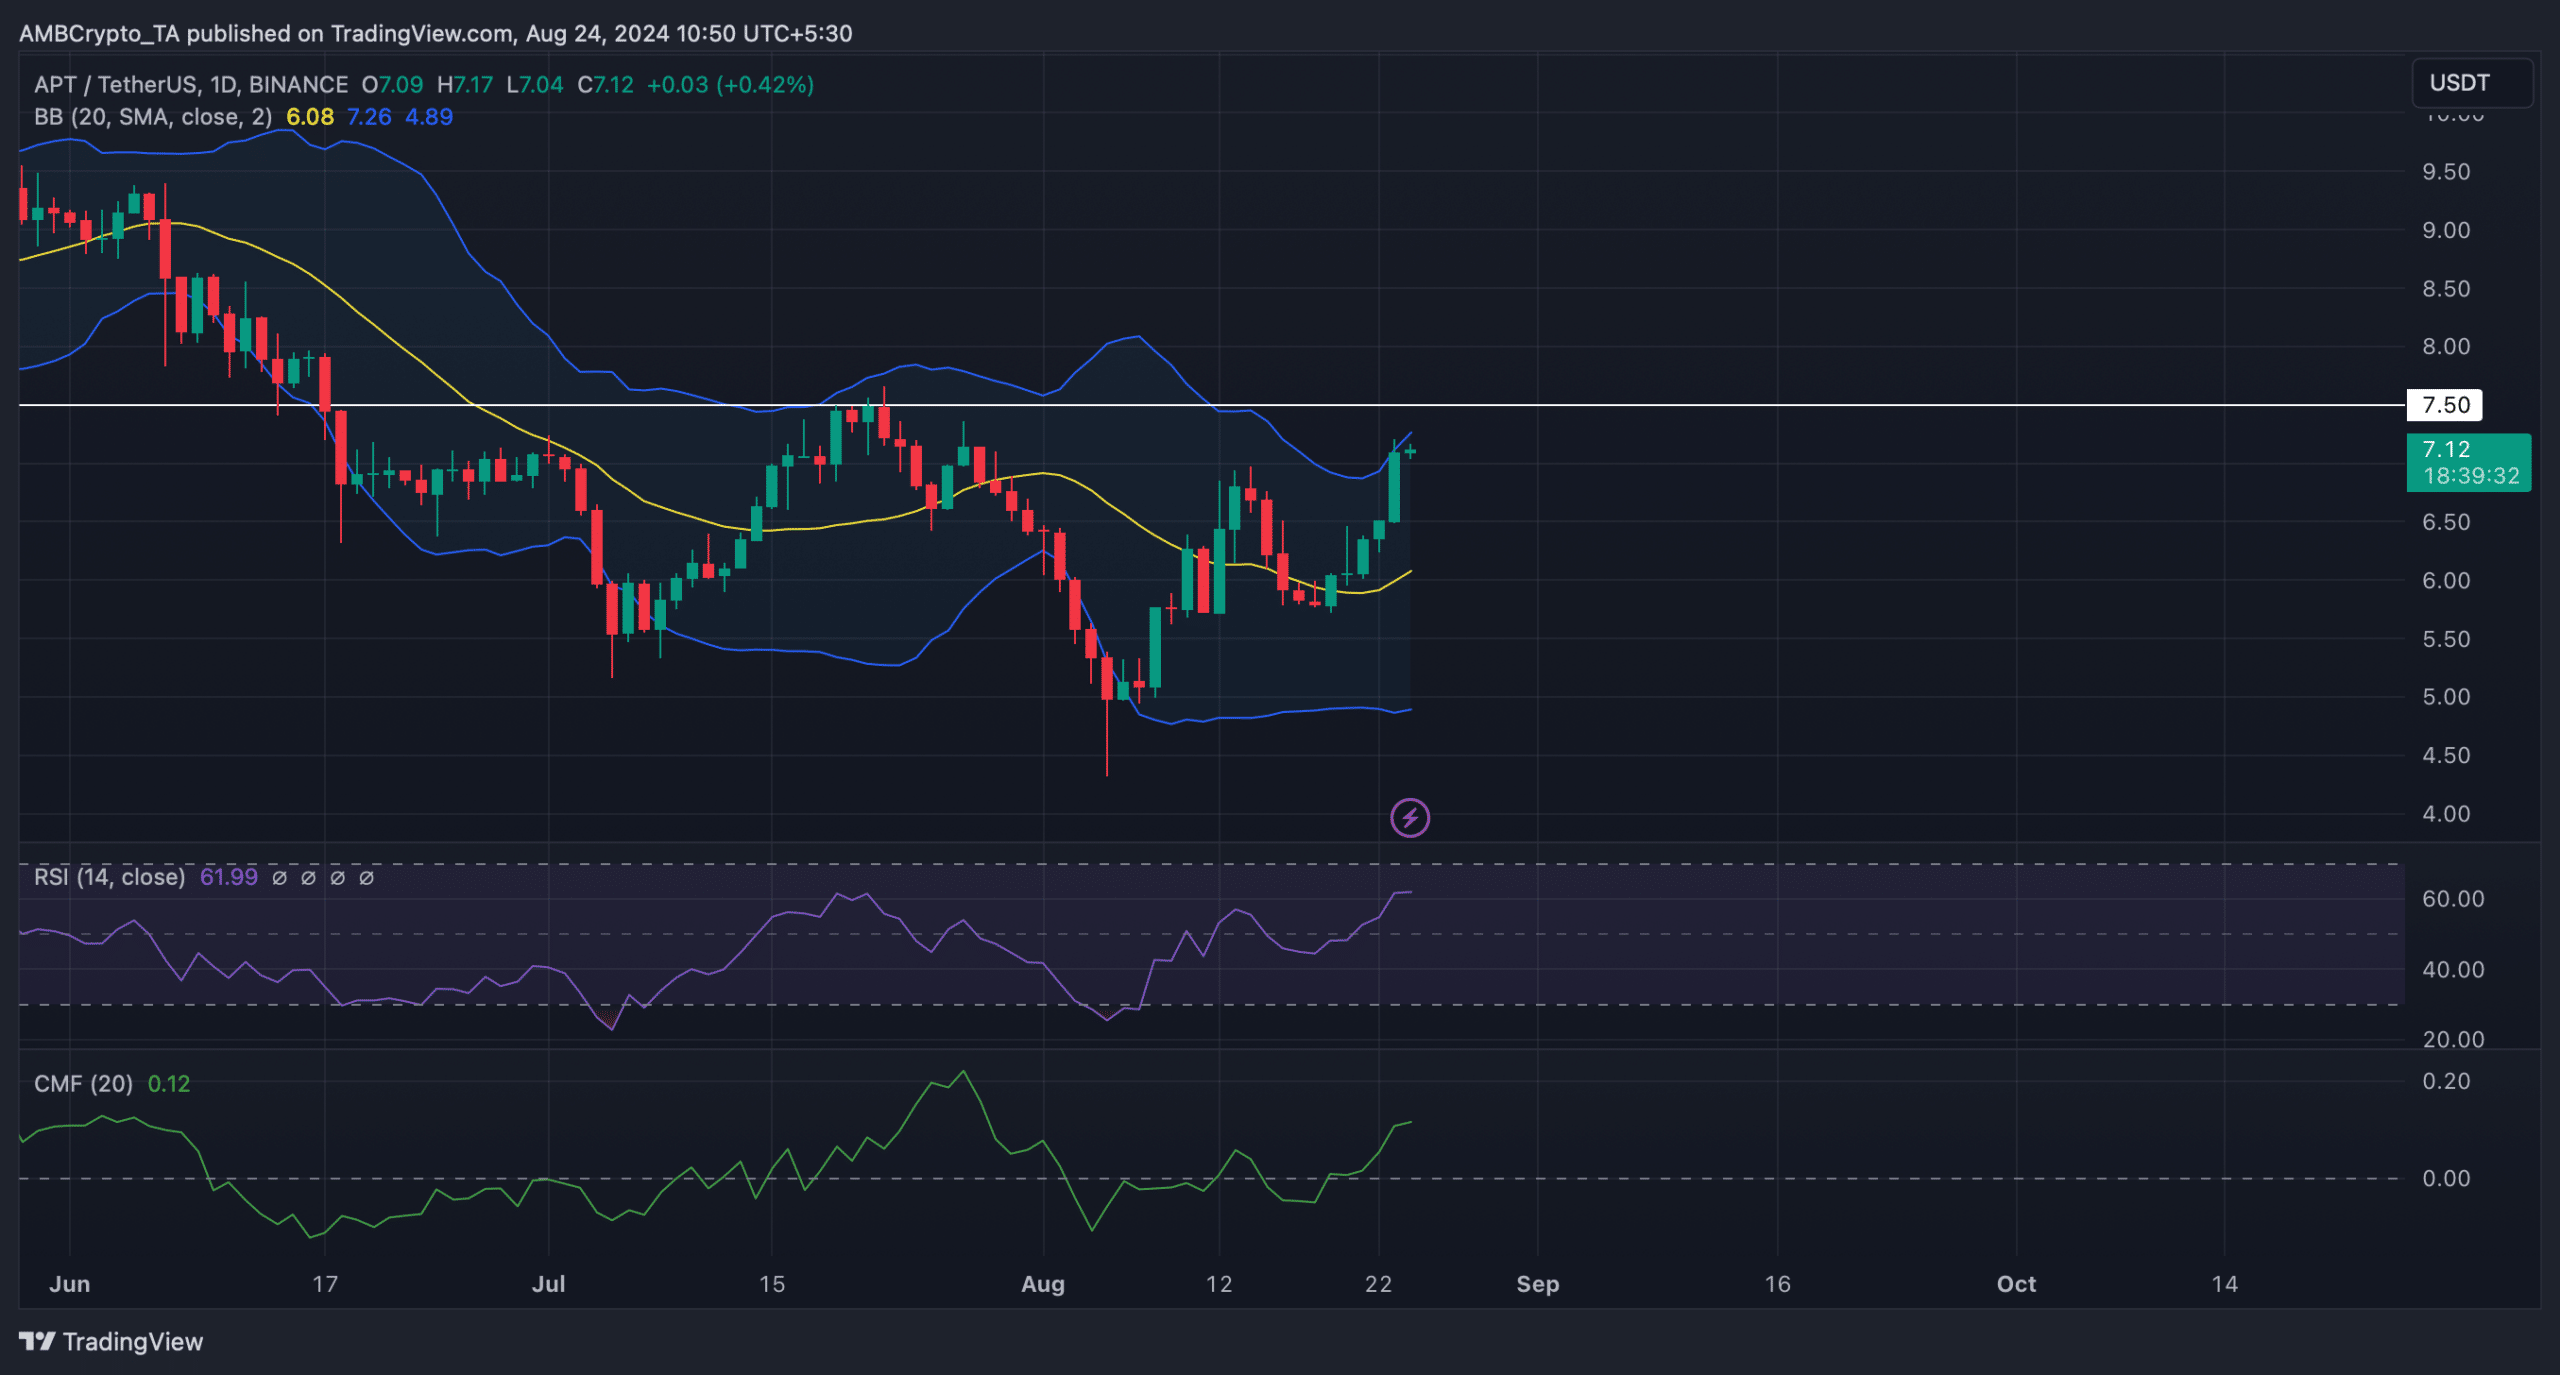
AMBCrypto finally analyzed APT’s daily chart to better understand what to expect from the token. As per our analysis, APT’s Chaikin Money Flow (CMF) registered a sharp uptick. The Relative Strength Index (RSI) was also resting above the neutral mark – A bullish sign.
Read Aptos’ [APT] Price Prediction 2024-25
However, the token’s price had touched the upper limit of the Bollinger Bands, which often results in price corrections. Nonetheless, if the bull rally continues, it will be crucial for APT to climb above its resistance near $7.5.

Source: TradingView

