
- BTC has declined by 2.44% over the past 24 hours.
- Bitcoin’s NUPL suggest a potential to a record high of $130k-$160k.
Bitcoin [BTC] has struggled to maintain an upward momentum since hitting $108,364. Since then, the crypto has faced downward pressure hitting a low of $92,118. Thus, over the past weeks, BTC has consolidated between $92k and $107k.
In fact, as of this writing, Bitcoin was trading at $96,298. This marked a 2.44% decline on daily charts.
Despite the recent struggles, stakeholders remain optimistic and see the decline as a mere market correction before another uptrend. Inasmuch, Cryptoquant analysts have predicted a rally to between $130k to $160k citing Bitcoin’s NUPL.
Bitcoin NUPL indicates a sustained bull rally
In his analysis, Cryptoquant analyst Baro Virtual posited that the NUP indicates that Bitcoin is in its final stages, with a target range of $130k-$160k.
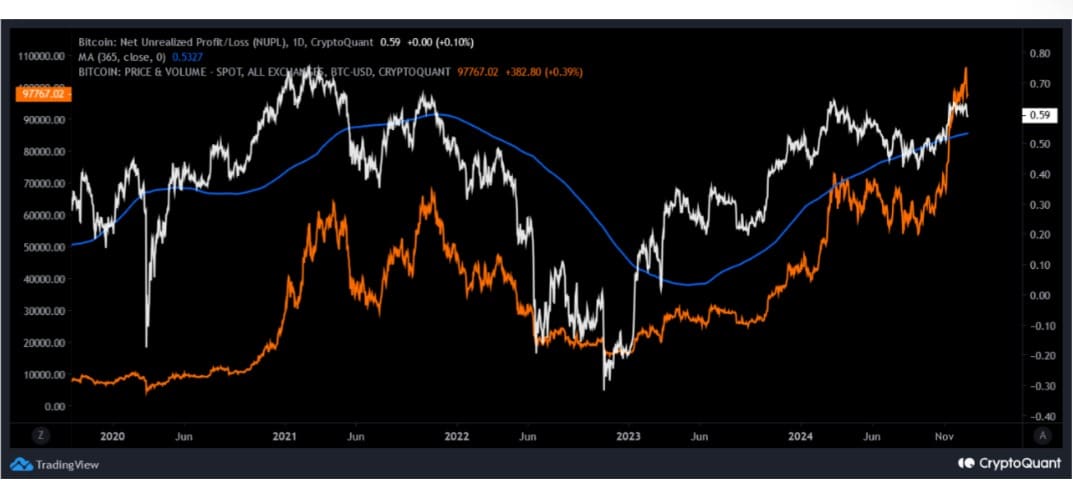
Source: Cryptoquant
This means that Bitcoin is nearing the top of its bullish cycle, where prices historically see a massive rally before peaking. In this phase, market participants are highly profitable, and speculative buying drives prices up.
According to him, the unrealized profit/loss index has formed a cup and handle pattern which is expected to push BTC into the target range of $130k to $160k.
When NUPL forms a cup and handle pattern, it implies that unrealized profits are consolidating with a slight dip suggesting a temporary slowdown in market sentiment before a strong continuation upward.
In addition, Bitcoin made a successful breakout through the NUPL index’s 365-day MA signaling a potential uptrend in both the medium and long term.
What BTC charts suggest
While Bitcoin has struggled to maintain, an upward momentum, long-term prospects are still in favor of a strong upswing.
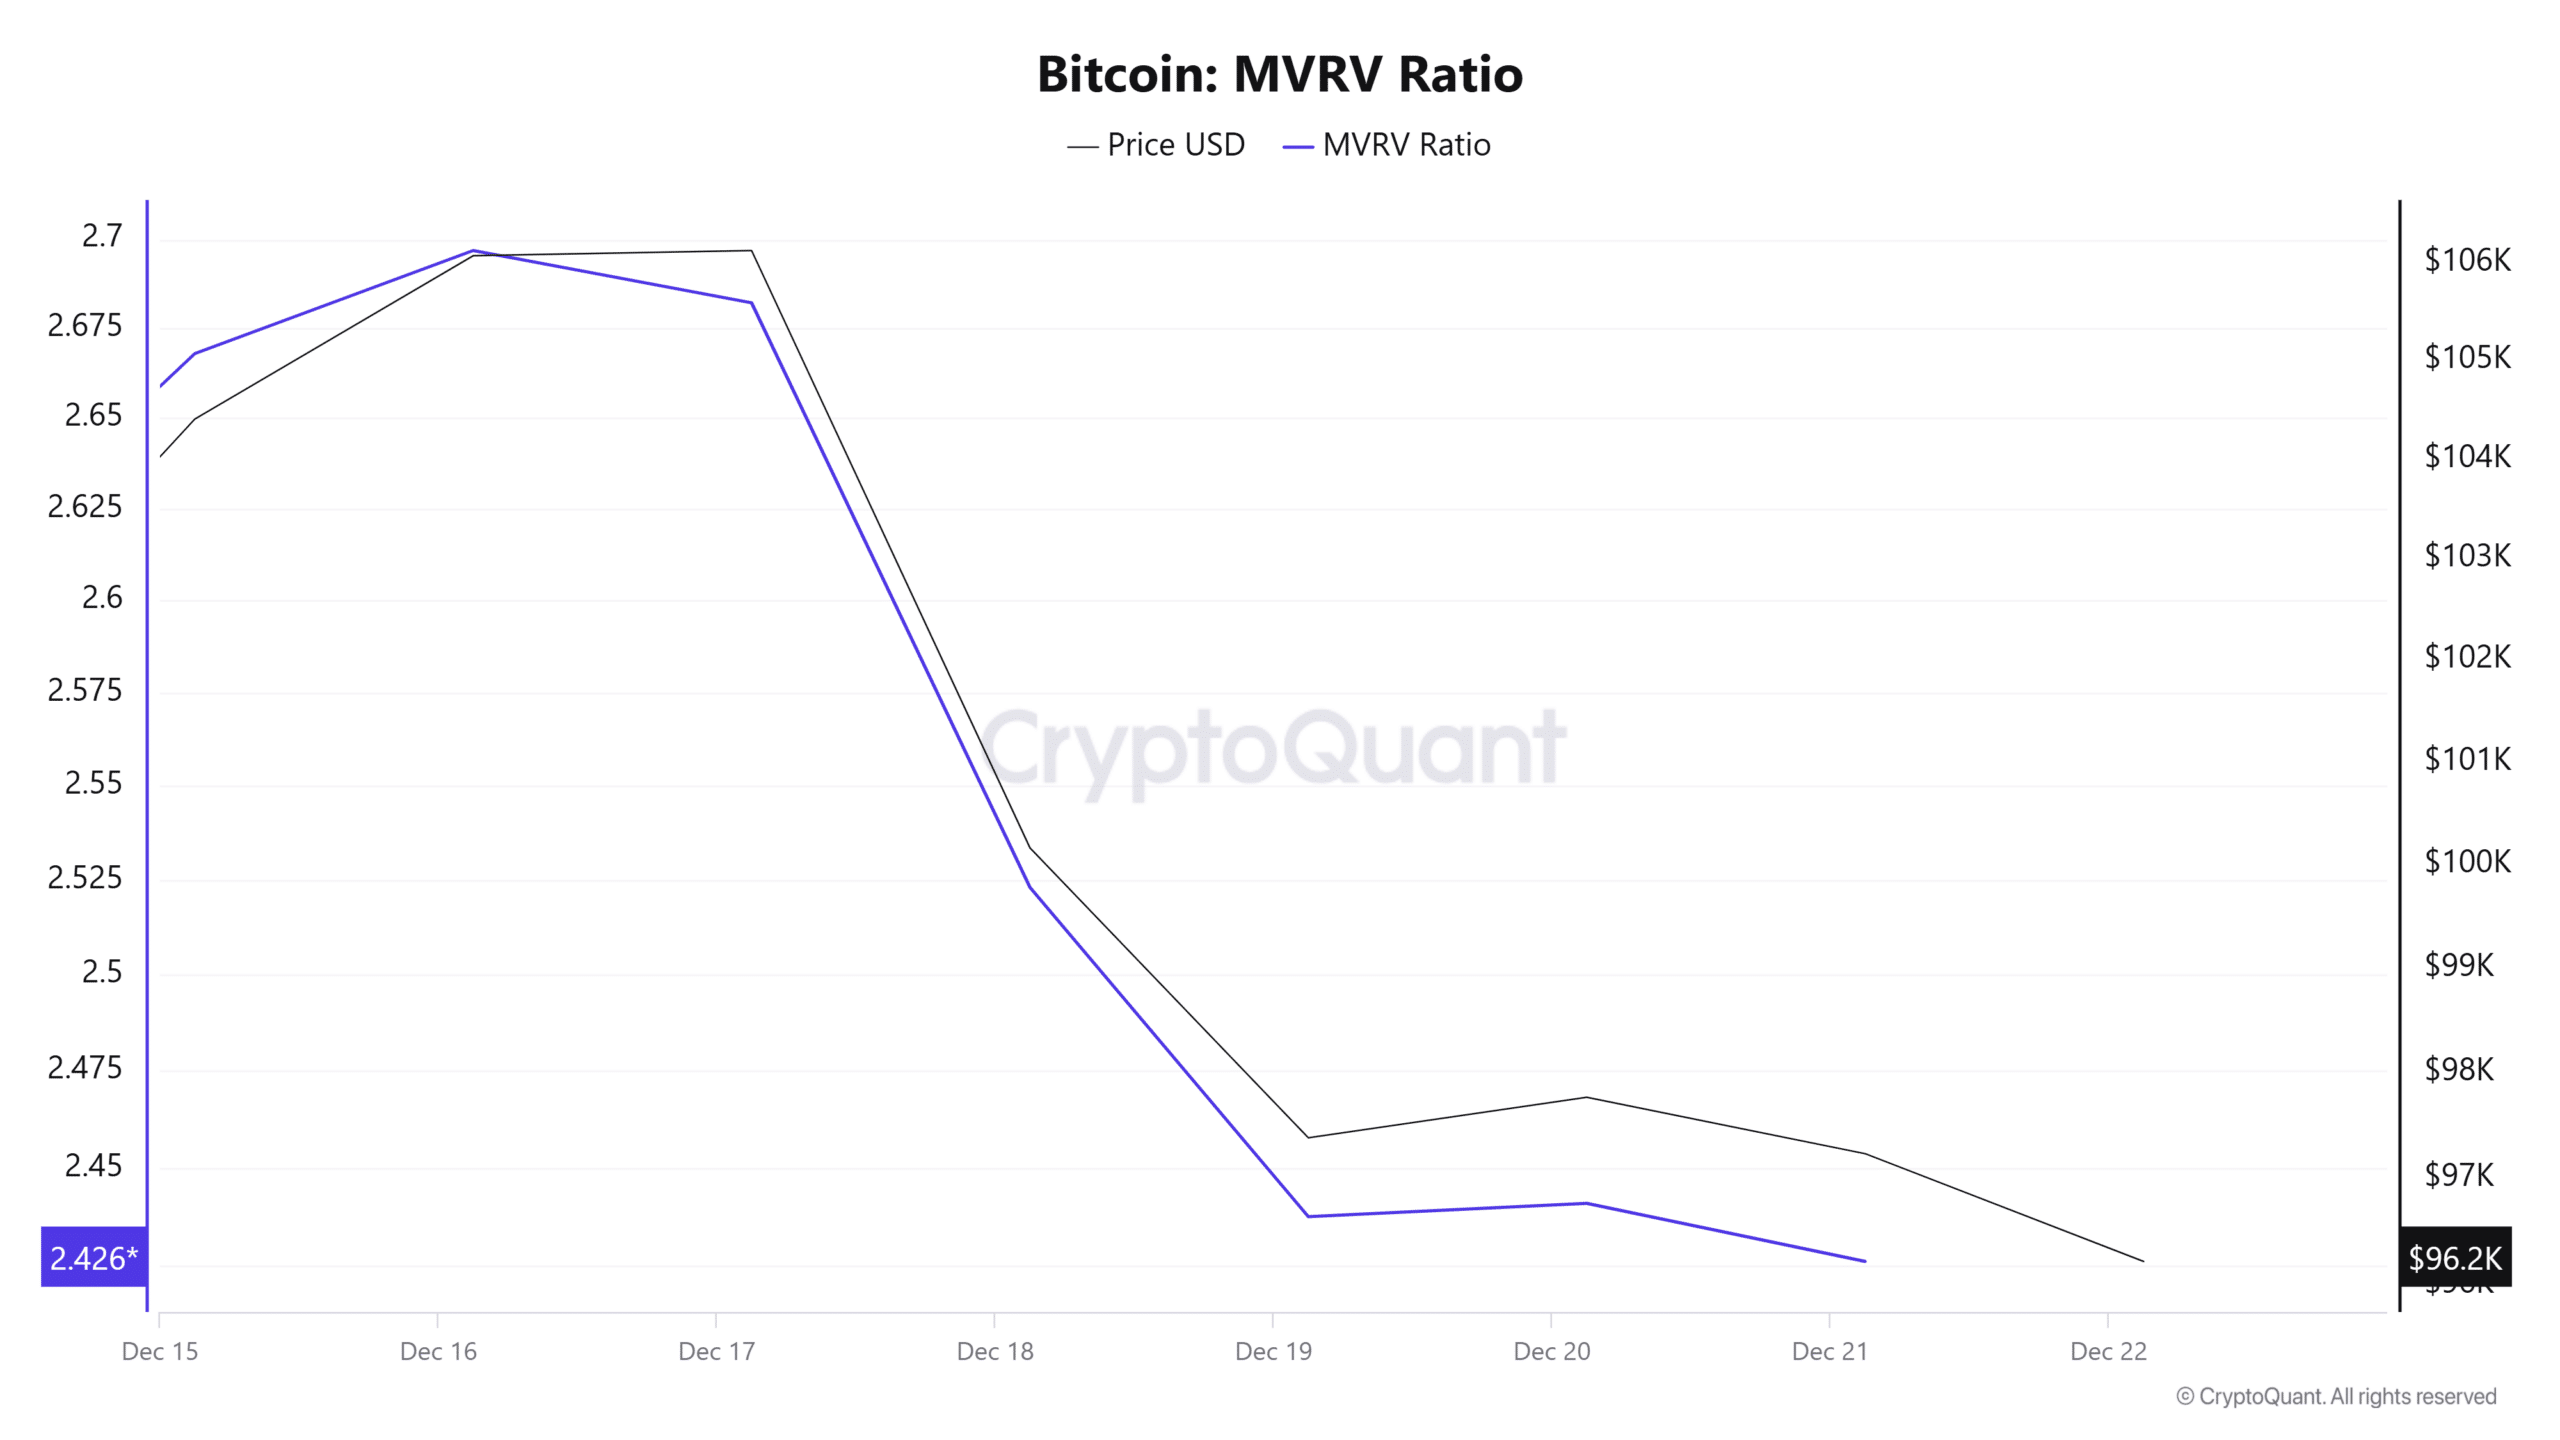
Source: Cryptoquant
For starters, Bitcoin’s MVRV ratio has dropped over the past week to 2.42. Historically, an MVRV ratio between 2-3 is considered bullish and neutral.
Thus, market is not overheated and buyers find a reasonable balance between risk and reward. This indicates market stabilization and potential price recovery.
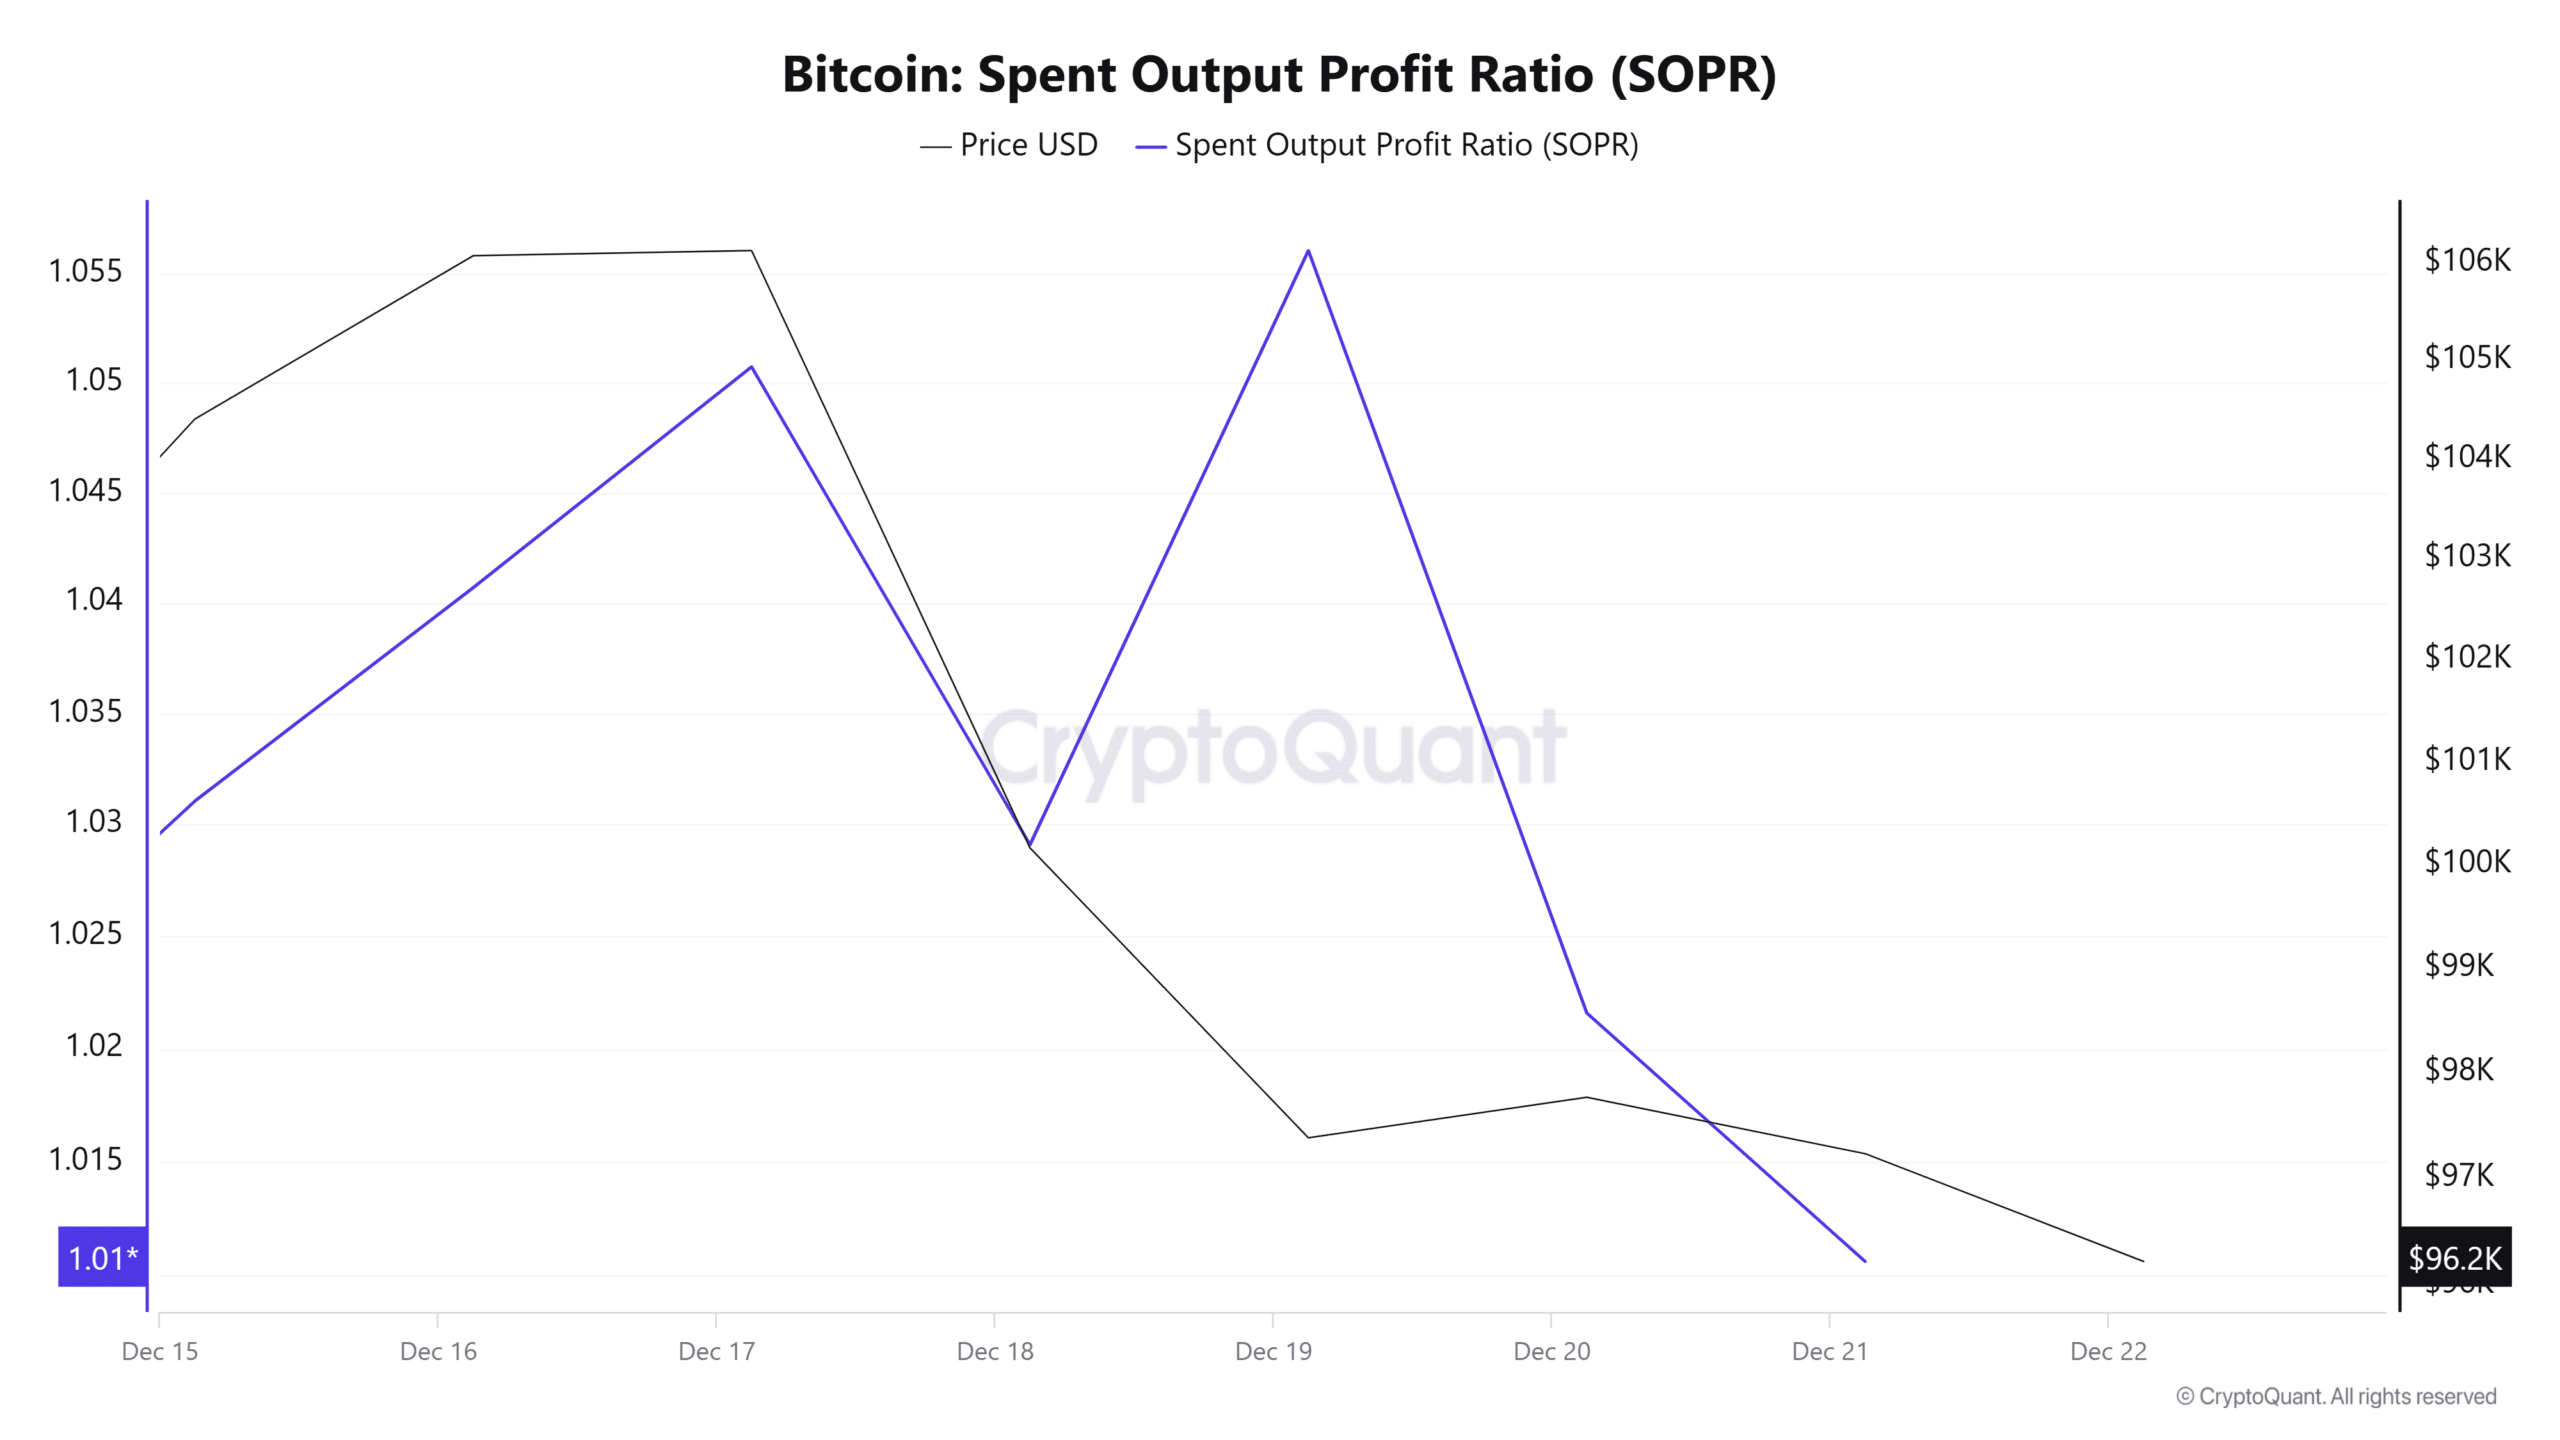
Source: Cryptoquant
Additionally, Bitcoin’s SOPR has declined but it has stabilized at 1.01. When SOPR stabilizes around 1, it suggests that BTC is testing a break-even point where the market is neutral. Thus, long-term holders see it as an opportunity to accumulate BTC sold by weaker hands.
Source: Cryptoquant
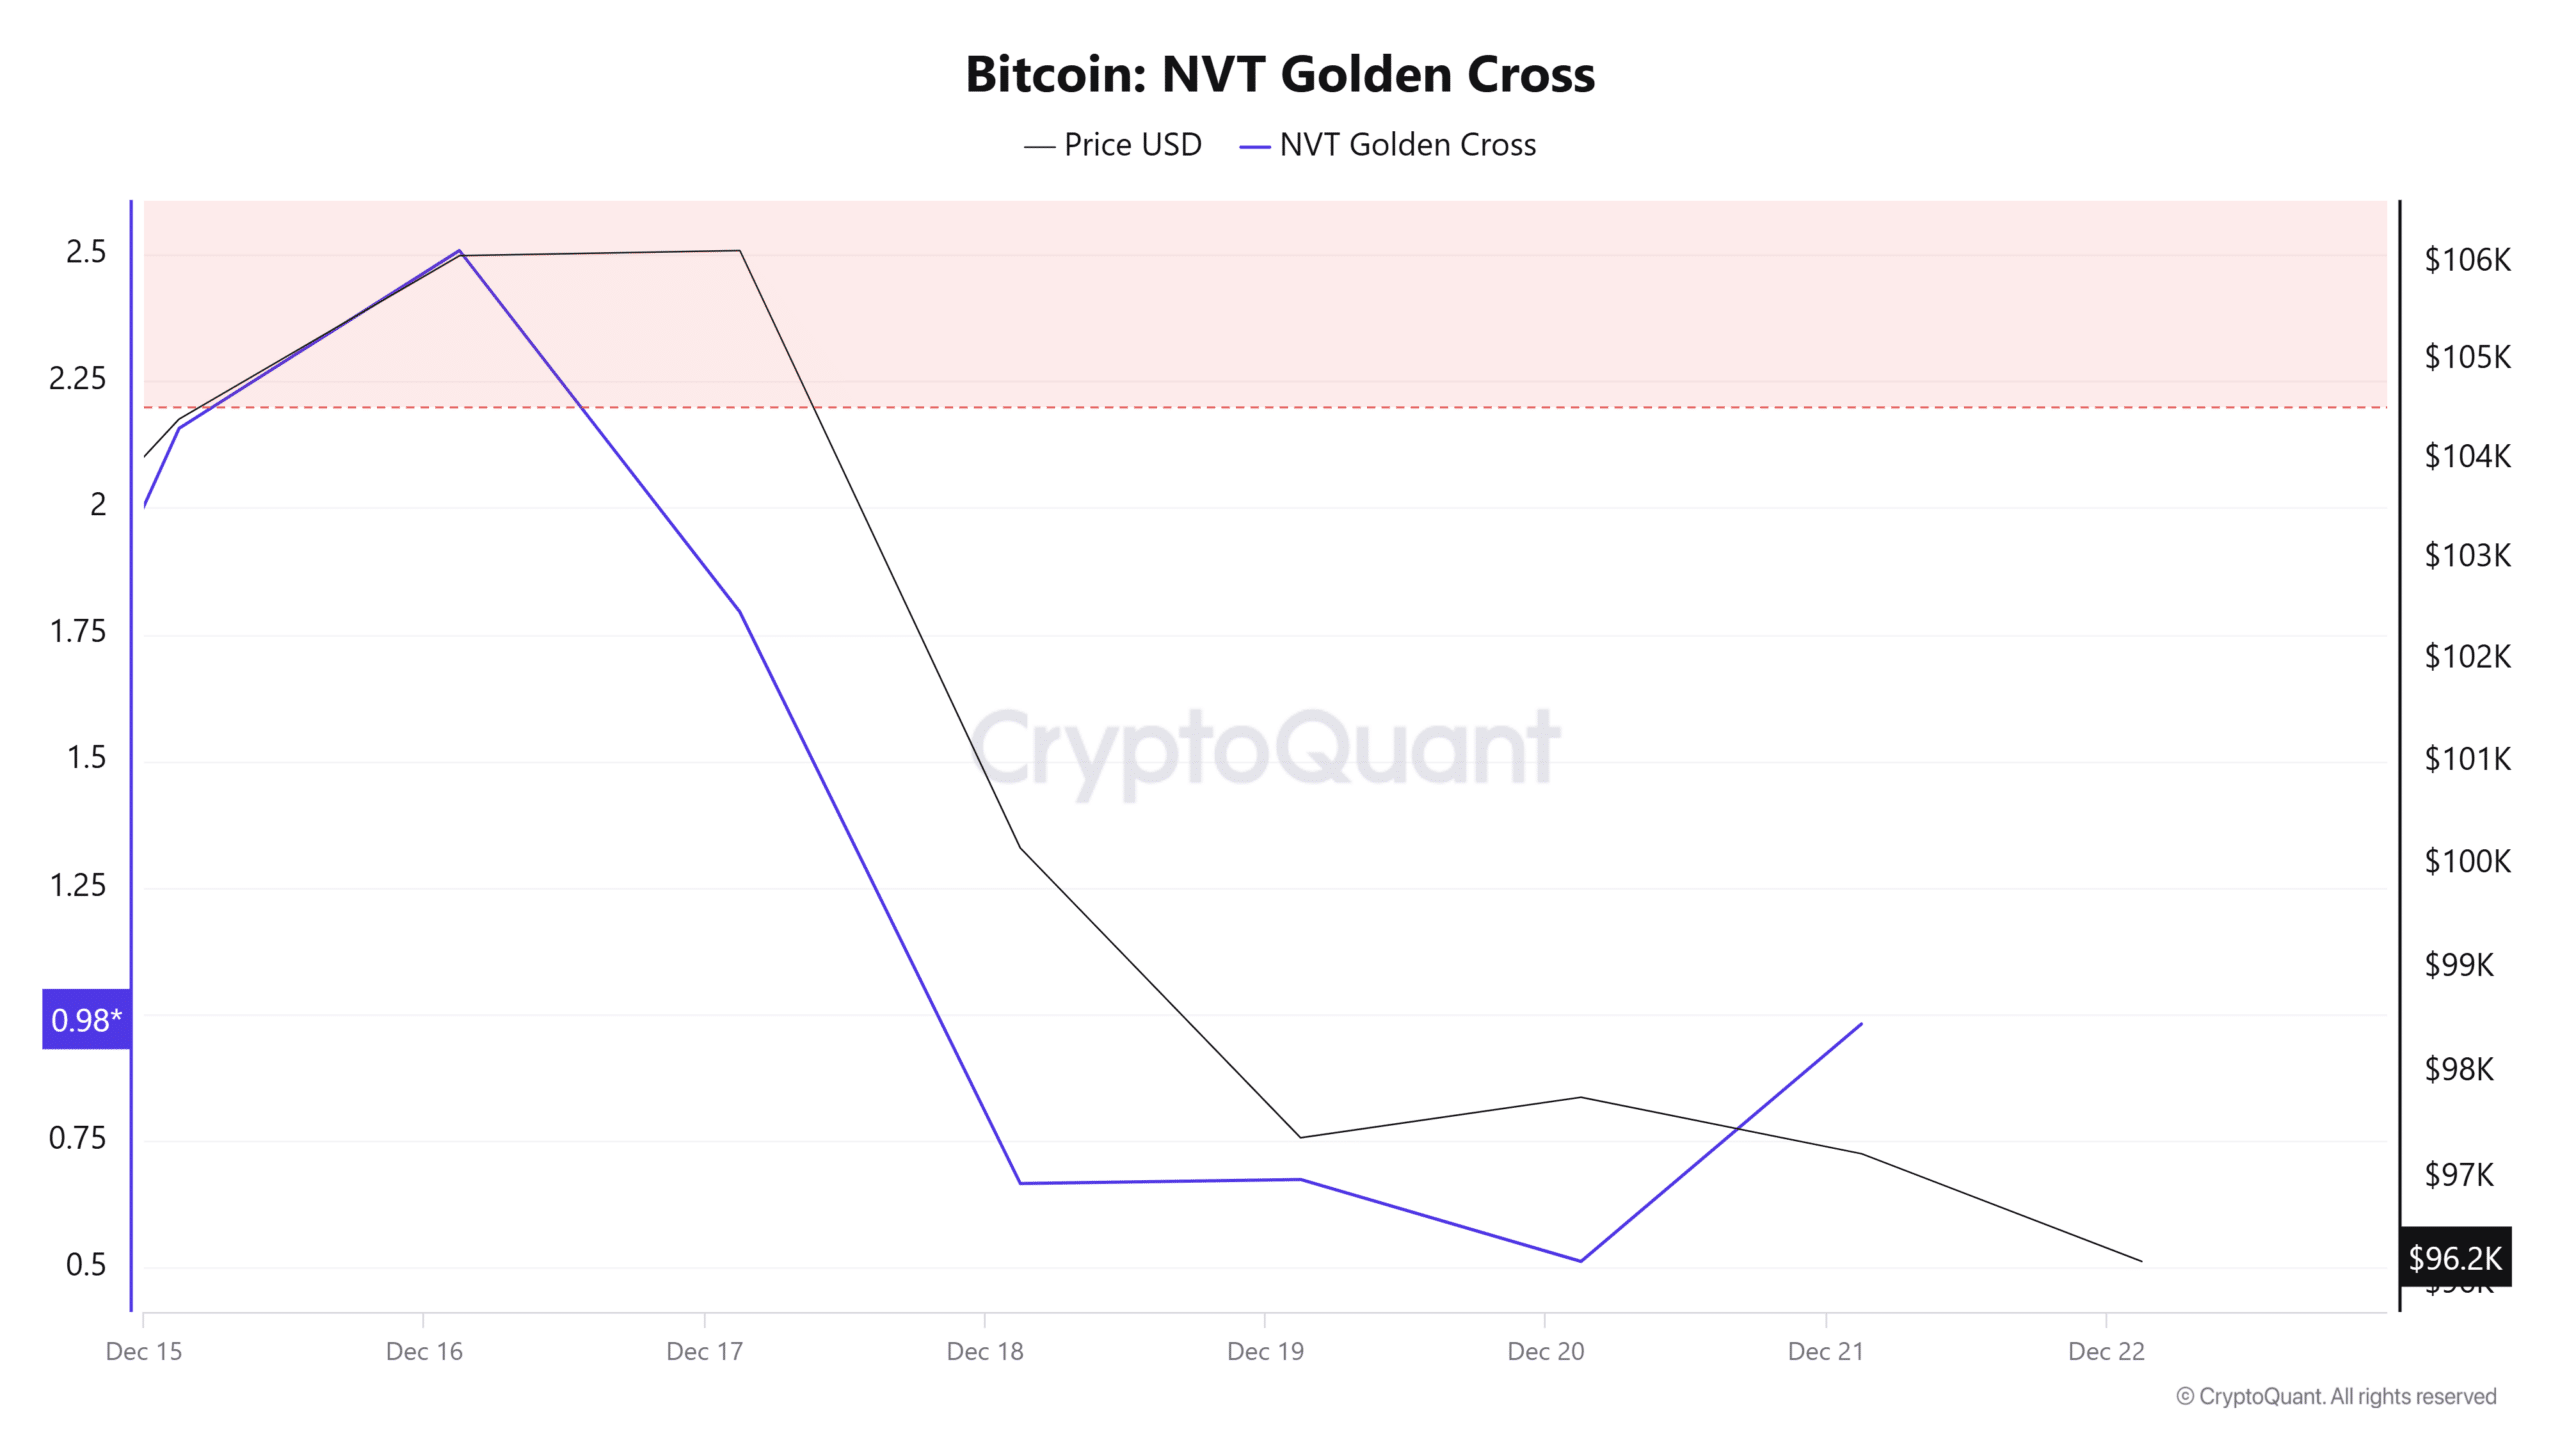
Finally, Bitcoin’s NVT Golden Cross has declined to 0.98 indicating a bullish divergence where increasing transaction activity reflects growing confidence in the network activity.
Read Bitcoin’s [BTC] Price Prediction 2024-25
Simply put, although Bitcoin has retraced over the past week, long-term fundamentals signal a potential recovery after the correction.
Therefore, these conditions point towards a potential trend reversal. If it happens so, we could see BTC reclaim $99790 resistance. However, if bears continue to strengthen, Bitcoin will drop to $95600.