- Ethereum’s Funding Rates hit 0.03%, signaling bullish sentiment and rising market interest.
- The key levels to watch are $3,800 resistance and $3,700 support as momentum builds.
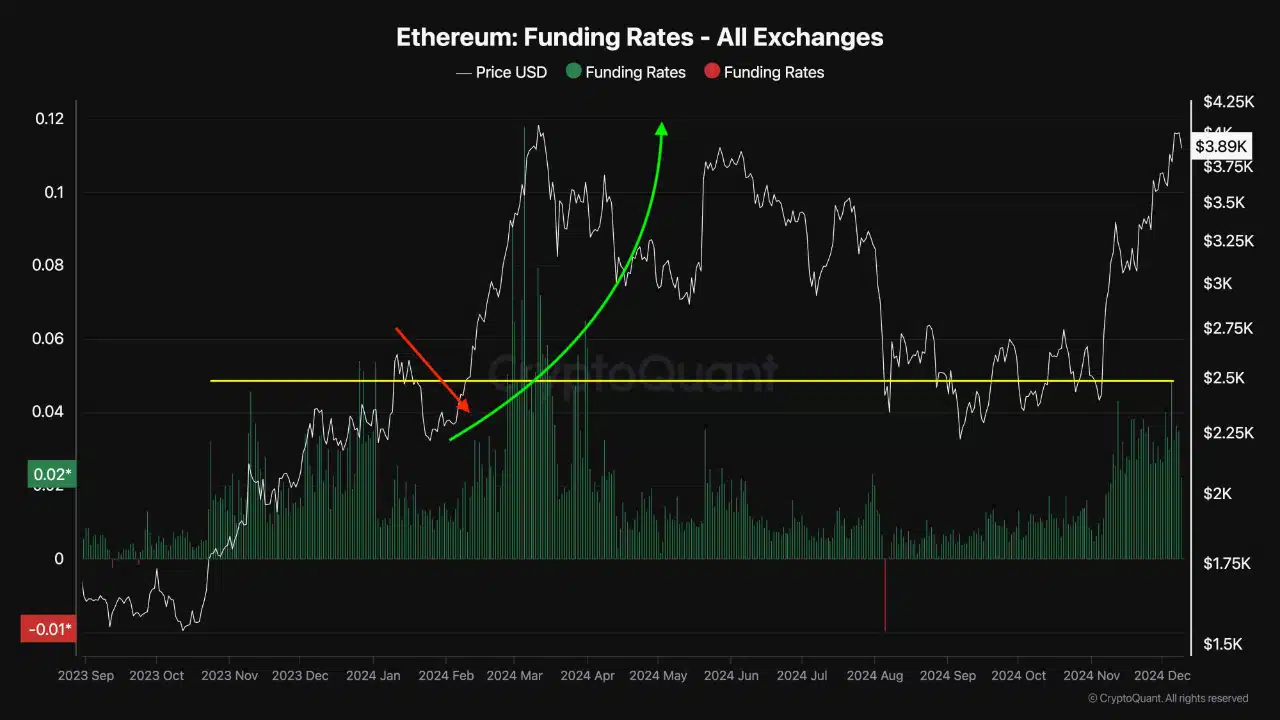
Ethereum’s Funding Rates have surged to multi-month highs, reaching levels last observed in January 2024, when ETH experienced an 88% rally. This increase reflects growing bullish sentiment in the derivatives market, driven by a rise in open interest and shifts in trader positions.
The metrics suggest potential upside momentum for Ethereum as the market watches critical price levels.
Ethereum Funding Rates hit a major milestone
The Ethereum Funding Rates chart, per CryptoQuant, shows a significant increase to 0.03%, marking a pivotal moment in market dynamics.
Elevated funding rates historically indicate traders leaning heavily toward long positions, reflecting expectations of further price growth. In January 2024, when funding rates reached similar levels, Ethereum embarked on a sharp upward rally.
This funding rate milestone may now foreshadow renewed bullish trends if historical patterns hold.

Source: CryptoQuant
Long/short ratio shows nuanced market sentiment
The long/short ratio, per Coinglass, was 0.9301% at press time, with long positions accounting for 48.18% and short positions at 51.81%.
However, analyzing the number of trader accounts reveals a stark contrast, with long accounts at 81.47% and short accounts at 18.53%, resulting in a long-to-short account ratio of 4.40.
This disparity highlights a market where fewer traders hold large short positions while a significant majority are betting on Ethereum’s long-term price appreciation.
This imbalance could lead to heightened volatility, as any substantial liquidation could trigger sharp price movements.


Source: Coinglass
Open interest: Rising market participation
Ethereum’s open interest rose to over $19.5 billion, reflecting increased trading activity and growing investor interest in ETH derivatives. This steady rise in open interest, combined with higher Ethereum Funding Rates, indicates a strong inflow of capital into the market.
Historically, such conditions have preceded major price movements, and the current trend suggests that Ethereum may be poised for another significant rally.
However, the open interest has dropped significantly recently. The analysis showed a drop to around $17.5 billion. Despite the drop, the bullish sentiment remains high.
Momentum builds around key Ethereum levels
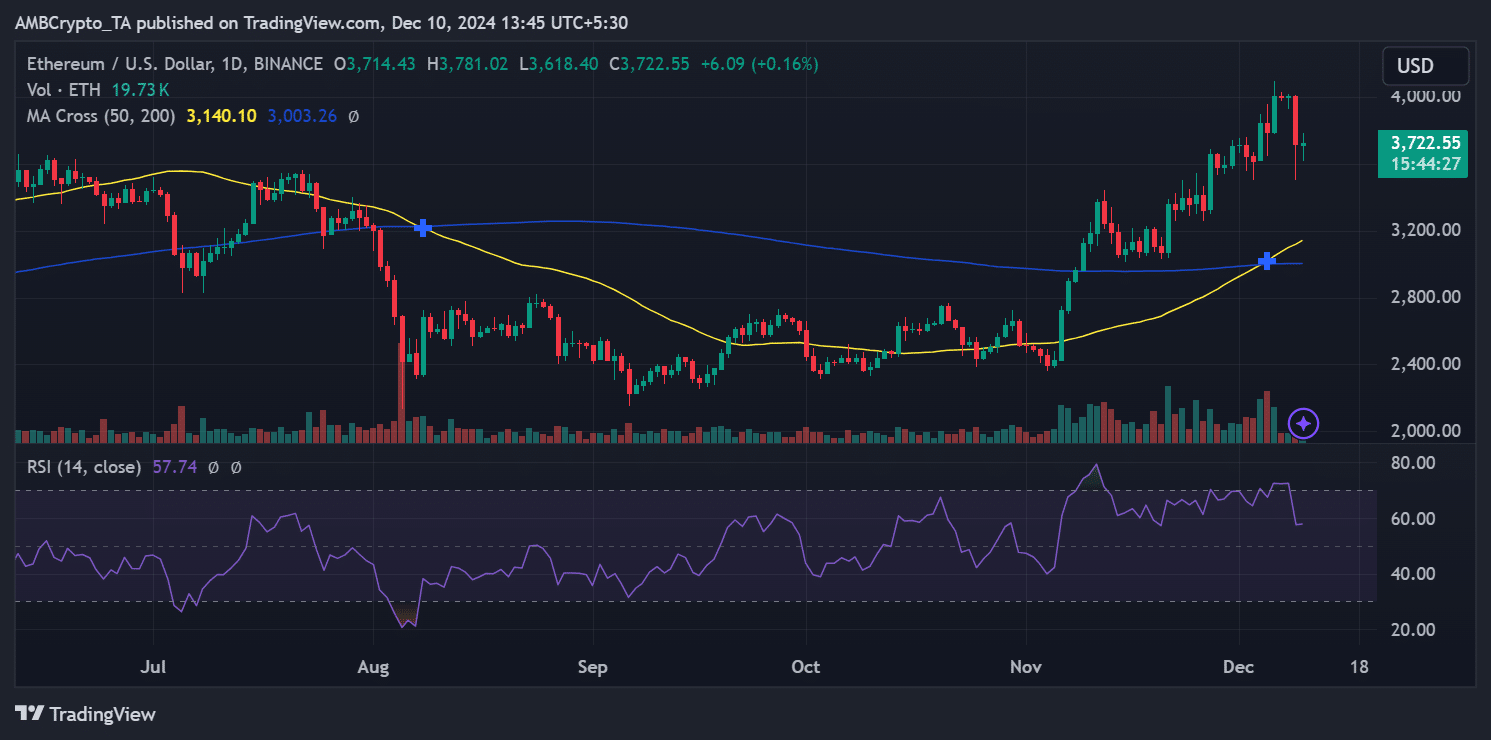
Ethereum is trading at $3,722.55, maintaining a positive momentum. The daily chart reflects a strong bullish structure, with key technical indicators aligning to support further growth.
The 50-day moving average, currently at $3,140, provides solid support, while the 200-day moving average at $3,003 confirms a long-term uptrend. The Relative Strength Index (RSI) is at 57.74, indicating moderate bullish sentiment.


Source: TradingView
Ethereum recently tested resistance near $3,800 but encountered selling pressure, leading to a slight pullback. A successful breakout above $3,800 could pave the way for Ethereum to test the psychological $4,000 mark.
On the downside, immediate support lies at $3,700, with stronger support near the 50-day moving average.
Trading volumes have also increased with open interest and the Ethereum Funding Rates, signaling strong market participation and reducing the likelihood of false breakouts. This convergence of metrics reinforces the bullish case for Ethereum’s price movement.
The surge in Ethereum Funding Rates, rising open interest and a nuanced long/short ratio reflect the market’s increasing optimism about Ethereum’s future.
Read Ethereum (ETH) Price Prediction 2024-25
While historical trends point to the possibility of a significant rally, traders should be mindful of potential volatility caused by over-leveraged positions.
Ethereum’s ability to break above key resistance levels will determine whether this bullish momentum can be sustained in the coming days.

