
- Cardano’s on-chain metrics came up with opposing inferences on market sentiment.
- A closer look at the price action suggested all is not yet lost for the bulls.
Cardano [ADA] formed a local high at $0.81 nearly a month ago but has been retracing its gains ever since. At press time, it was trading at $0.585, a 26.5% drop. A recent AMBCrypto report noted that whales were offloading their ADA tokens during the dip.
This was a bearish signal. Cardano’s consolidation under the $0.6 level should ideally (for the bulls) see a phase of accumulation. AMBCrypto took a look at some other metrics to understand the state of the ADA market sentiment.
Making sense of the conflicting signals
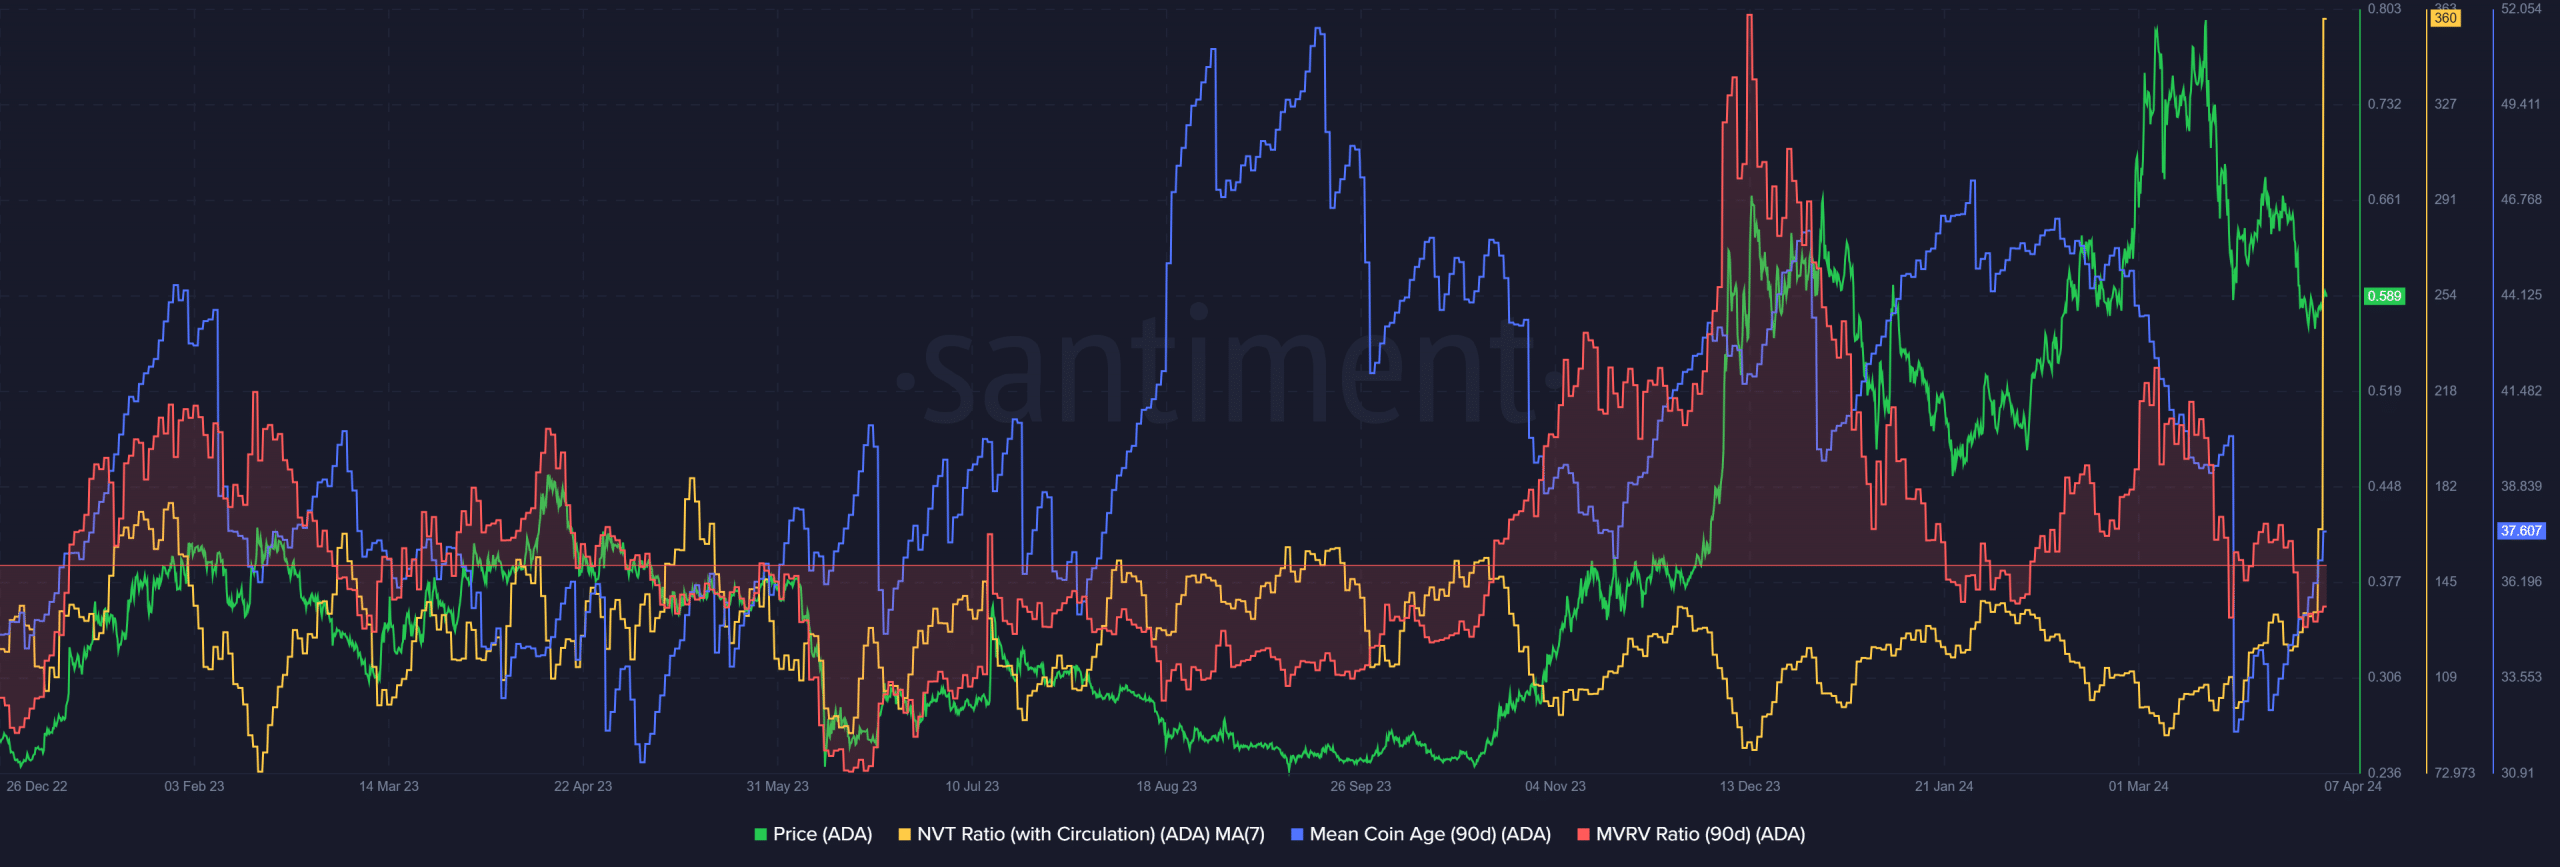
Source: Santiment
As mentioned earlier, ADA addresses relinquished some of their holdings in the past month. The number of wallets with 1k-1 million ADA was trending downward. The mean coin age (90-day) metric on the chart above also fell swiftly in the latter half of March.
Yet, it began to recover in the past two weeks. This indicated some accumulation was underway once more. The MVRV ratio was also in negative territory. This denoted that investors faced unrealized losses and that the asset was undervalued.
Another metric to track an asset’s network valuation is the Network Value to Transactions (NVT) ratio. The 7-day simple moving average of the NVT with circulation showed that the metric rose to 166 on the 6th of April. This was almost as high as May 2023 when we saw a reading of 185.
This showed that ADA was overvalued, which conflicted with the MVRV’s findings. Since these metrics were at an impasse, we will have to look elsewhere to resolve the dispute.
Assessing the market sentiment
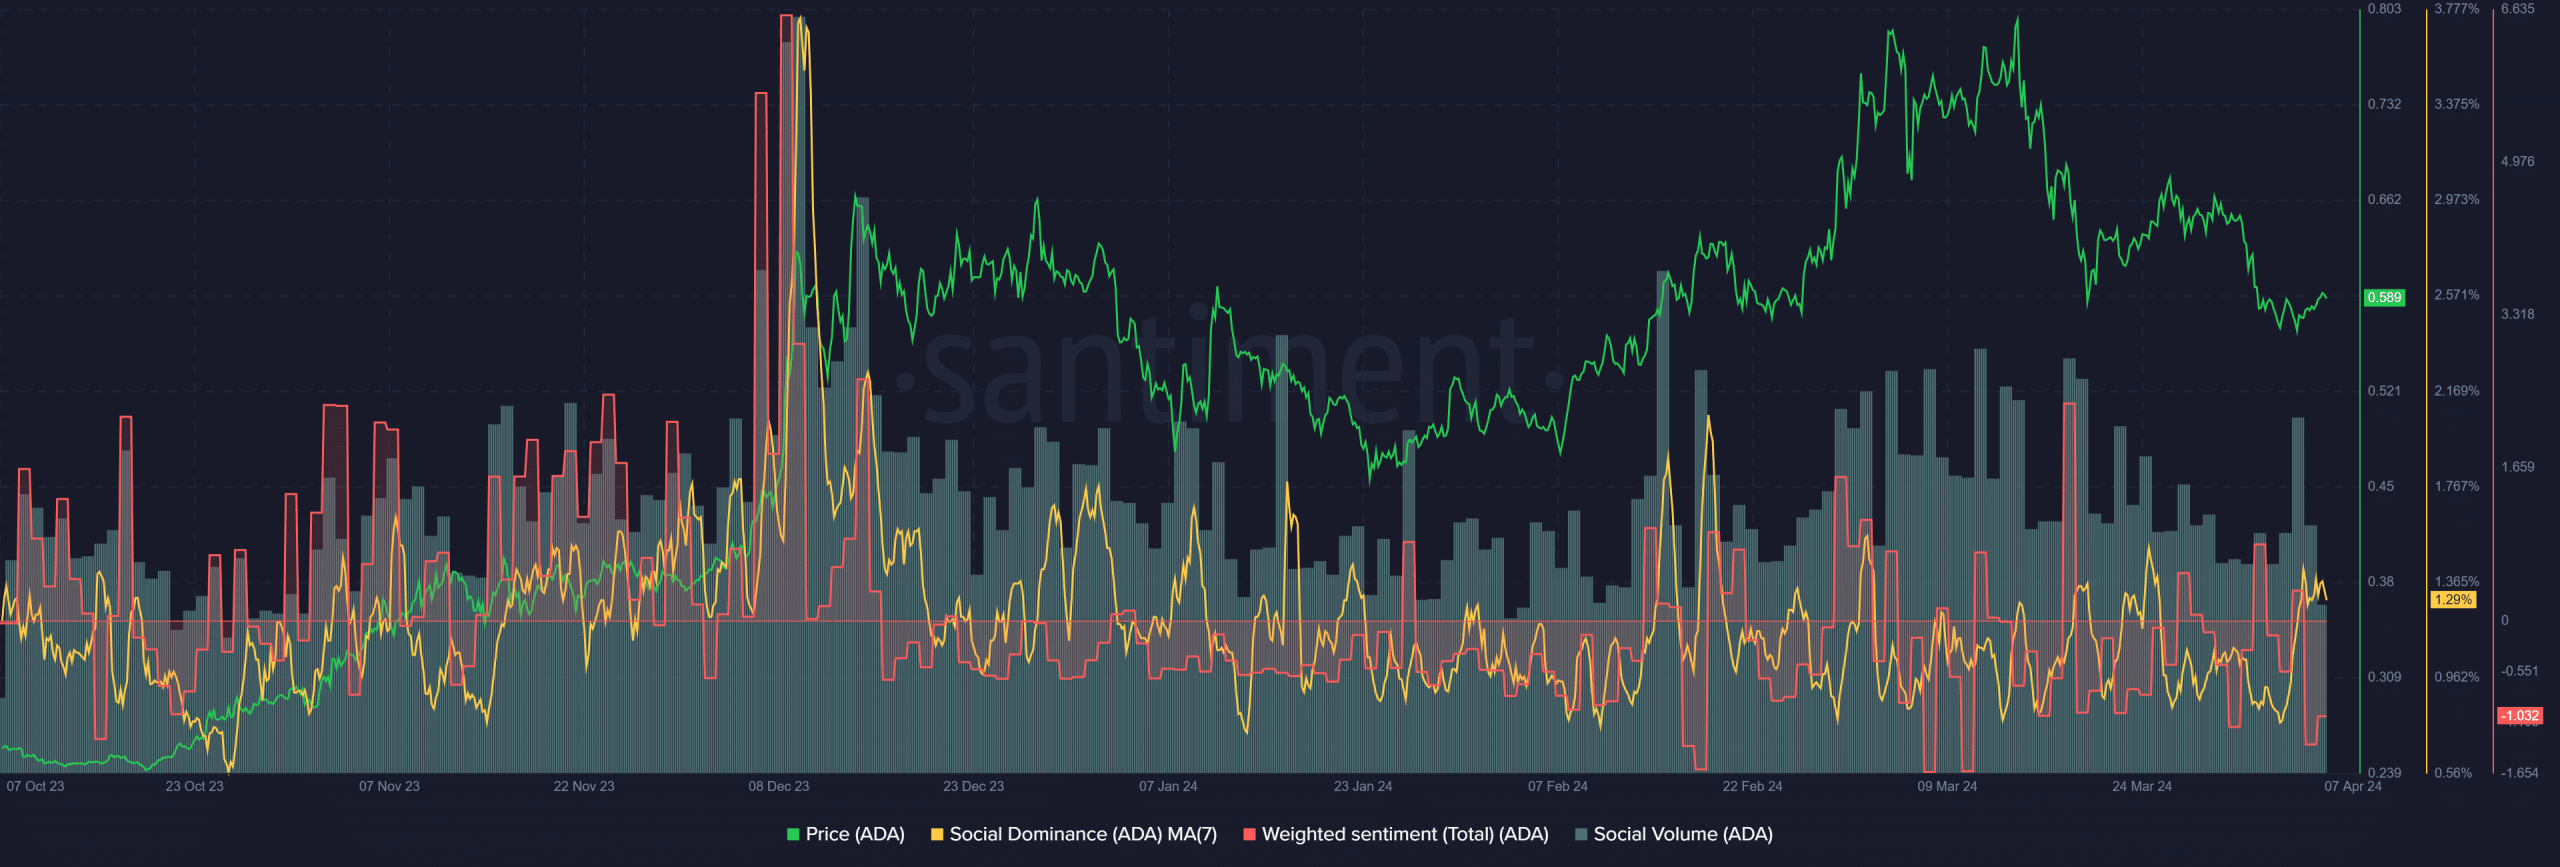
Source: Santiment
AMBCrypto looked at social metrics and the price action chart to understand where market participants stand. The 7-day SMA of the social dominance fell rapidly after the 24th of April.
Over the past week, it pushed higher once more. Meanwhile, the social volume has slowly declined since mid-March.
The weighted sentiment was also negative for the majority of the past month. This reflected a bearish sentiment amongst participants in social media. It also came alongside the decline in prices that ADA witnessed in recent weeks.
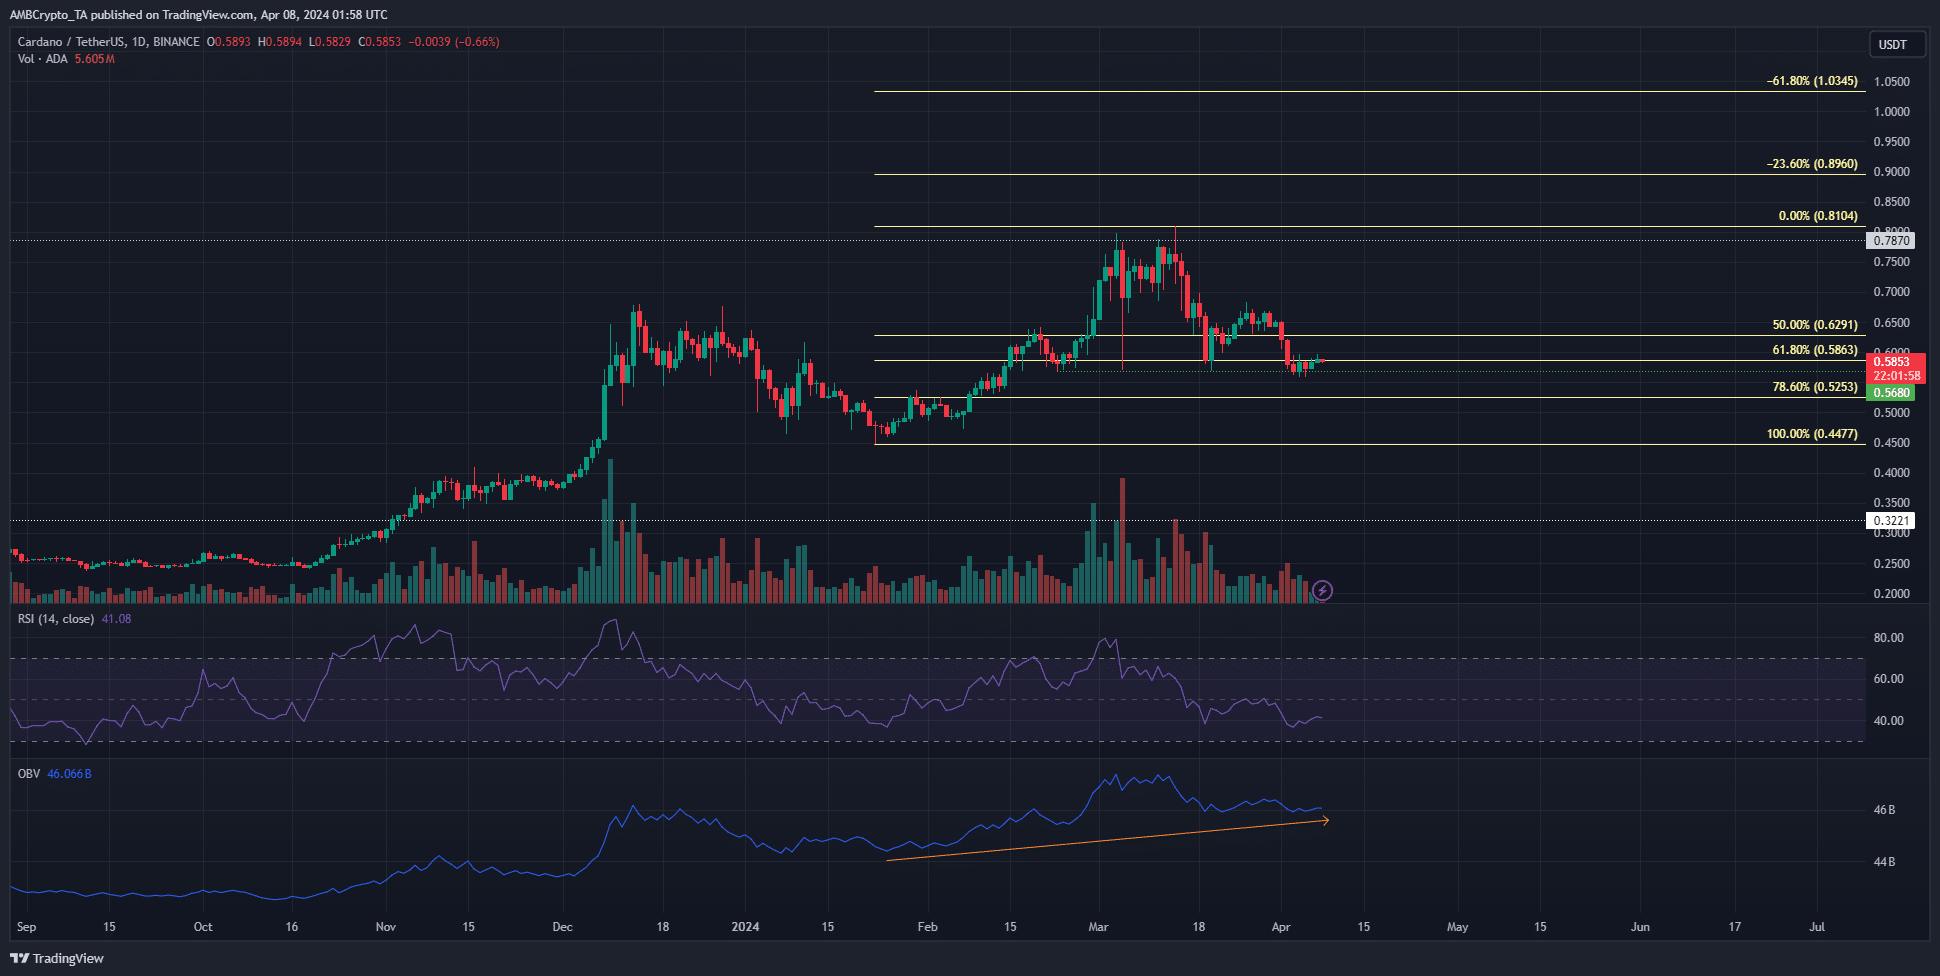
Source: ADA/USDT on TradingView
Technical analysis of the 1-day chart showed that the market structure was, just barely, bullish in this timeframe. The $0.568 swing low from late February did not see a 1-day trading session close beneath it yet.
The weekly chart showed strong bullishness after ADA beat the April 2023 lower high at $0.46 in December and continued to move higher.
Read Cardano’s [ADA] Price Prediction 2024-25
However, the RSI was at 41 and denoted a firm bearish sentiment. The Fibonacci retracement levels showed that $0.525 was the next support level that could beckon prices to it.
On the other hand, the OBV has resolutely trended upward since early February. This was an encouraging sight, which signaled that even a drop to $0.525 might be eventually reversed and that the market might not descend into a downtrend.