- Heightened Dogecoin circulation and lowered volatility highlighted HODL behavior
- Price action chart outlined $0.316 as a vital short-term support
At the time of writing, Dogecoin [DOGE] was struggling to trend higher on the price chart. The bullish euphoria around DOGE and the rest of the memecoin market from two months ago has evaporated though.
This was partly due to Bitcoin [BTC] which has struggled to establish the $100k-level as support over the past six weeks.
Source: CoinMarketCap
Data from CoinMarketCap revealed that the memecoin market cap was only $96.5 billion at press time, compared to $137 billion on 09 December. This correction underlined the bearish sentiment behind Dogecoin and other memes.
Can the sector’s leader recover in the coming weeks?
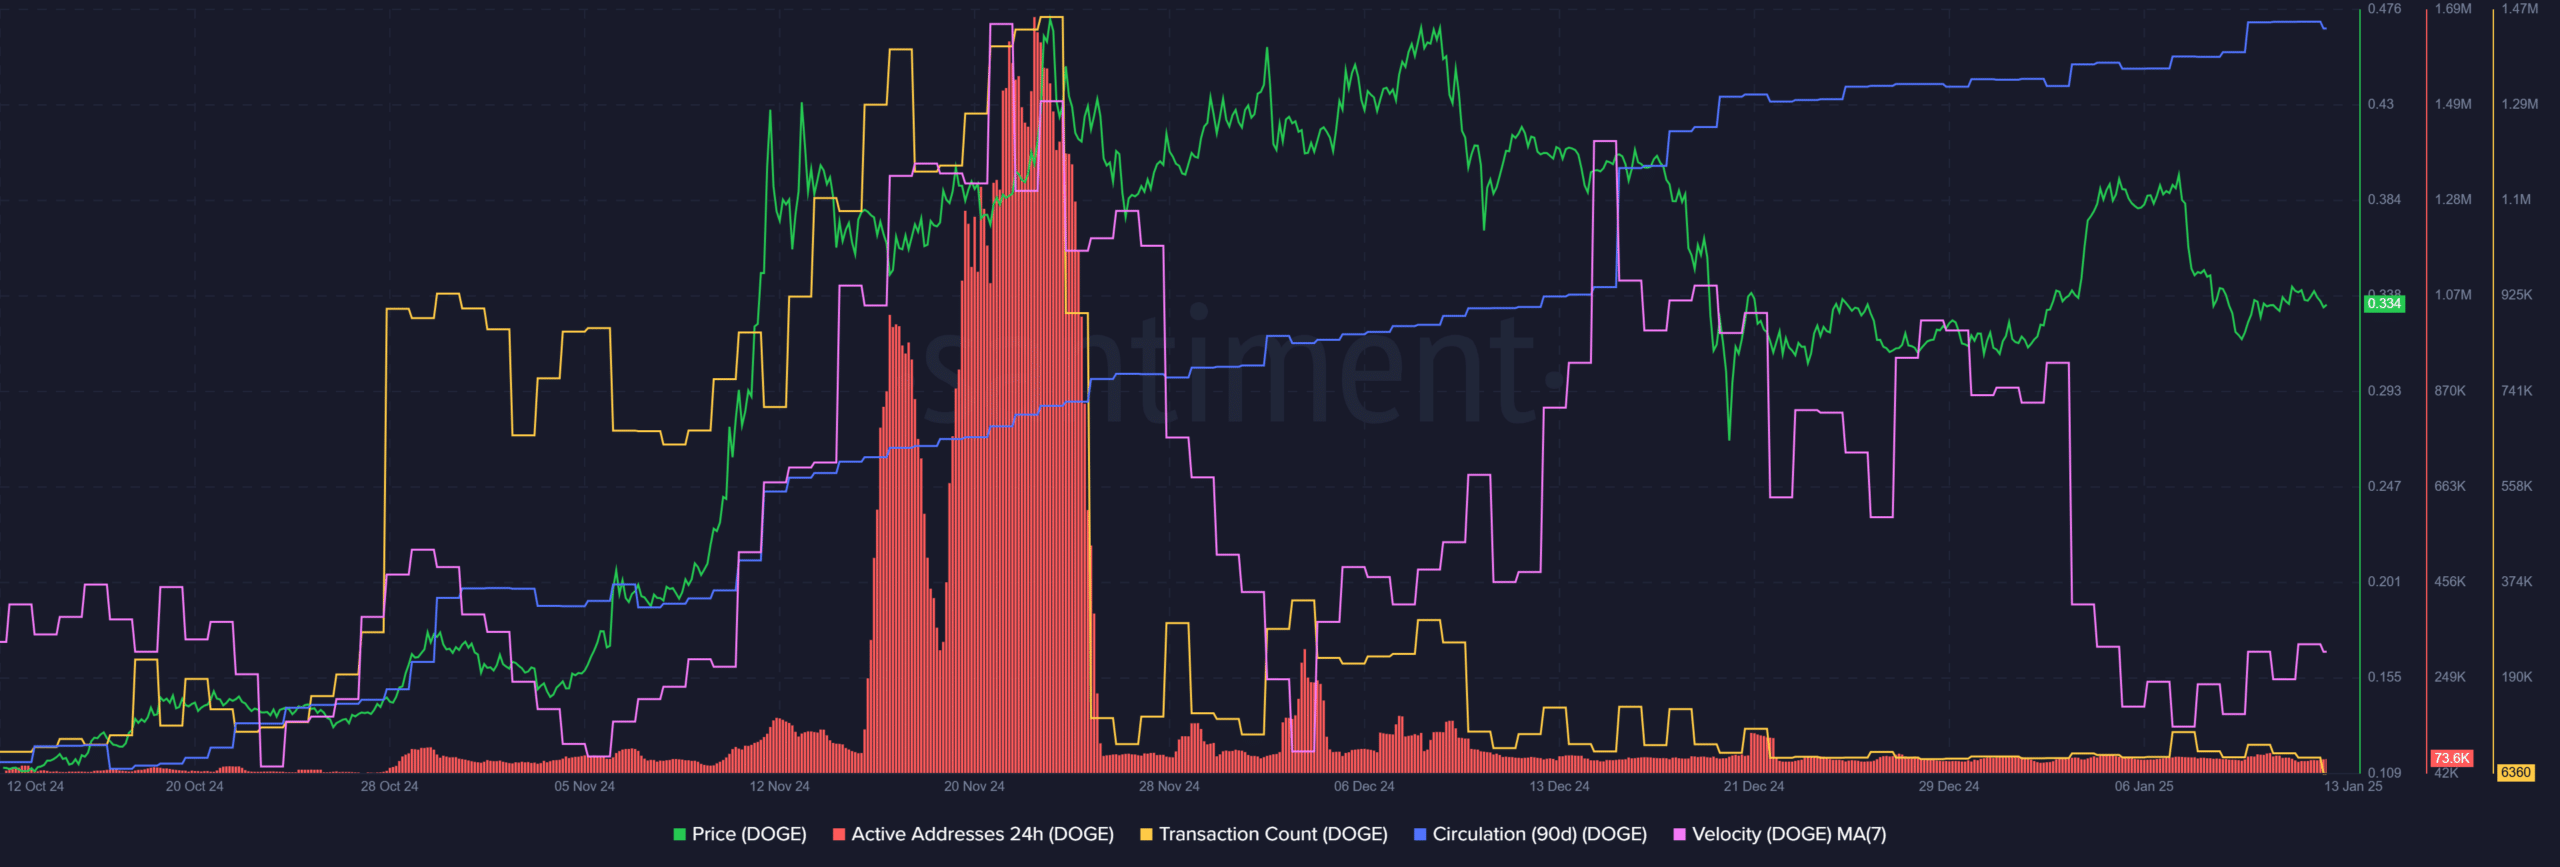
Daily active addresses fell off a cliff, have not recovered yet


Source: Santiment
When the memecoin fever was raging in November, the daily active addresses count for Dogecoin skyrocketed. It hit a peak of 1.68 million active addresses on 22 November, but was quick to retrace thereafter. The transaction count also dropped, especially after mid-December.
December and January were accompanied by steady low numbers of active addresses. It hovered around the 70k-mark, which was a respectable number by itself, but very far off from its recent peaks.
The 90-day circulation referred to the unique tokens transacted during the given time period of 90 days. This metric has trended steadily higher over the past two months, showing heightened demand for DOGE. However, the token velocity’s 7-day moving average has been falling.
This suggested the average number of times the DOGE token changed hands has been falling – A sign of lowered trading and increased holding behavior. Therefore, it can be taken as a signal of accumulation on-chain.
Chances of a short-term Dogecoin recovery


Source: DOGE/USDT on TradingView
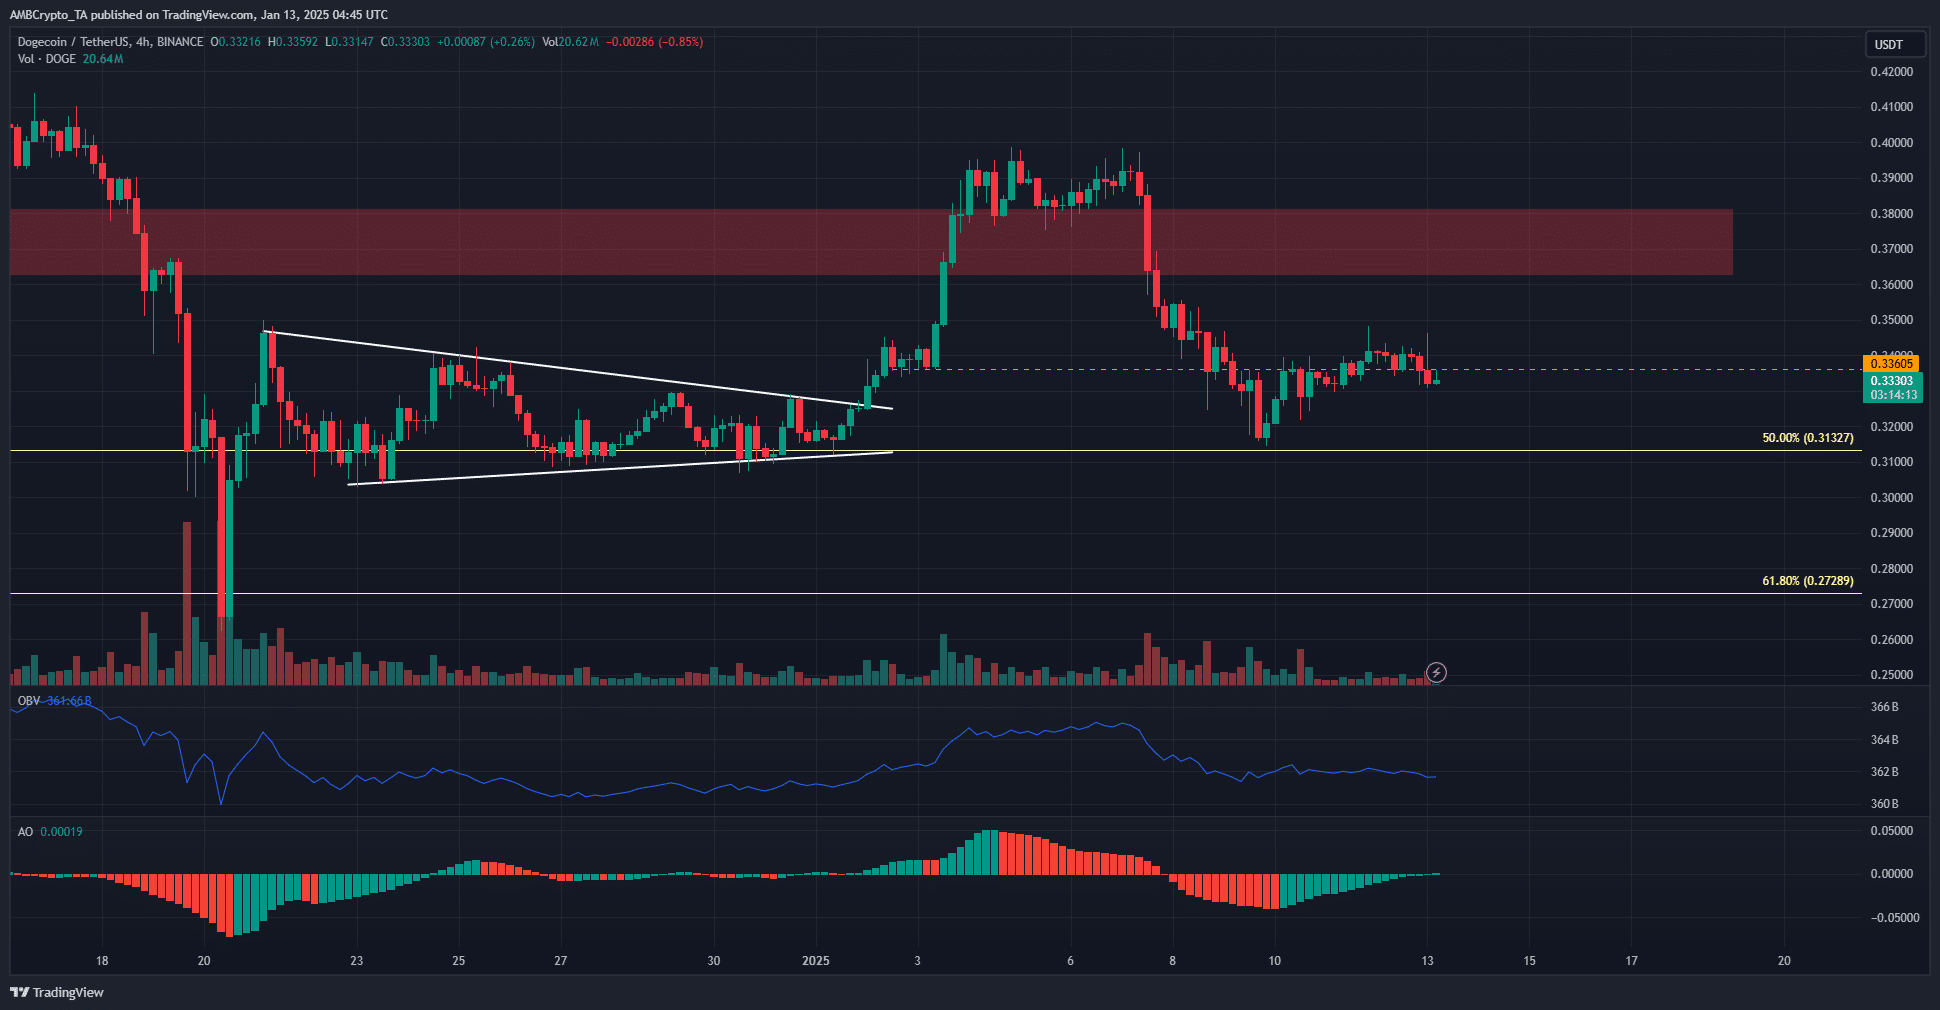
The market structure on the 4-hour chart was bearish. The bounce from the 50% retracement level set a lower high at $0.341. A 4-hour trading session close above this level would be a bullish structure break.
The trading volume was in decline over the past week, during the price bounce. The OBV has been lukewarm recently and trended downwards last week.
The volume indicators underlined a bearish case, but the momentum has been shifting bullish. The Awesome Oscillator crossed over above neutral zero too. In fact, the $0.336-$0.34 region could be retested once again.


Source: Coinglass
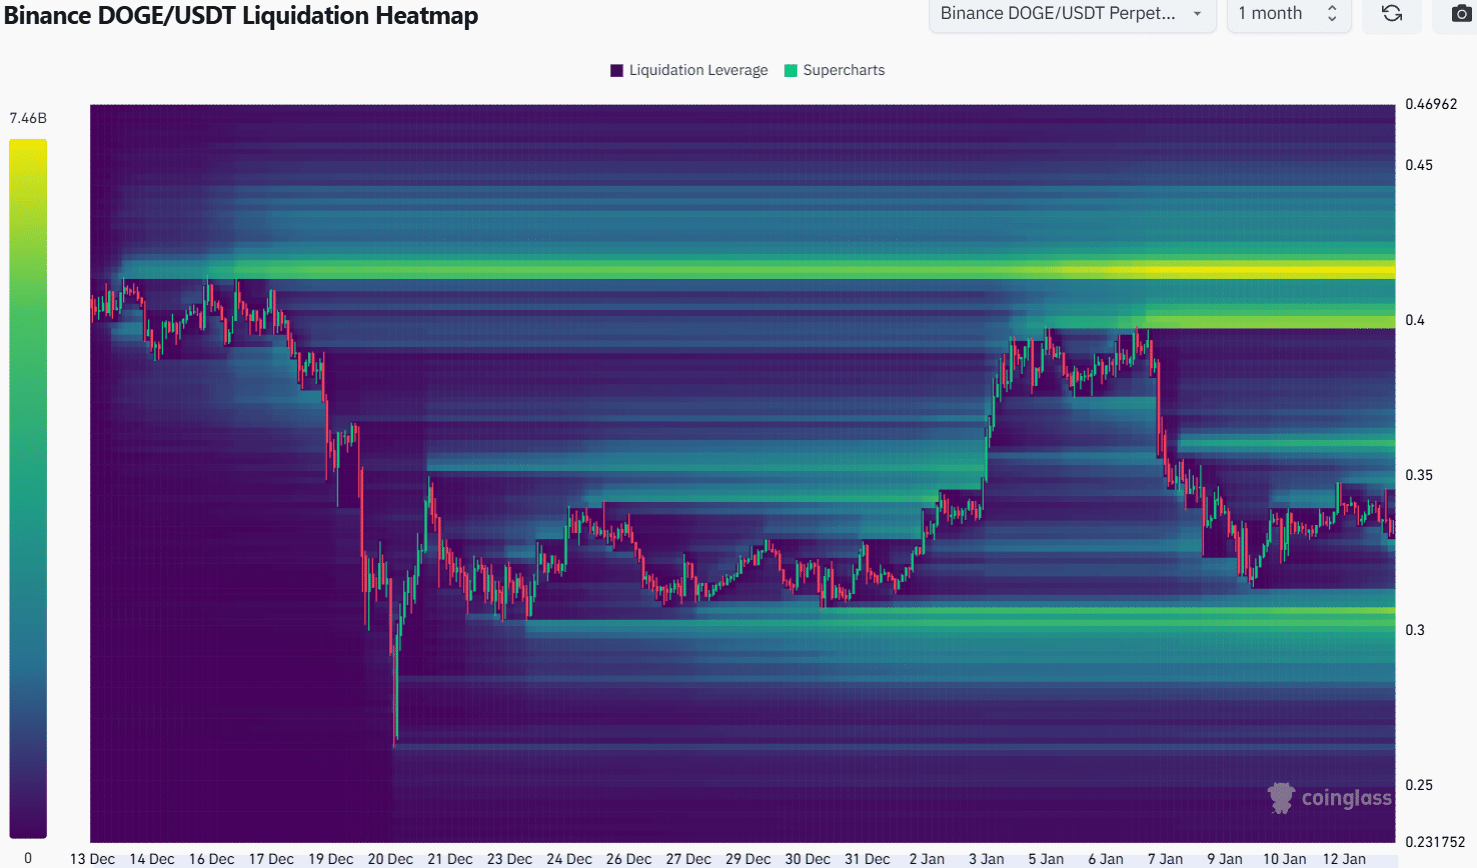
The past month’s liquidation heatmap highlighted two key areas of interest for Dogecoin. The $0.3-$0.306 zone to the south is a strong magnetic zone, one that could see a bullish reversal once swept.
Is your portfolio green? Check the Dogecoin Profit Calculator
To the north, the $0.36-level had a sizeable cluster of liquidation levels as well. Based on the volume indicators, a move to $0.3 would be more likely over the next week or two.

