
- A falling wedge pattern formed on ONDO’s chart, which might trigger a 50% rally.
- Most metrics and market indicators looked bullish.
ONDO bears continued to dominate the market last week as its price chart remained red. However, investors must be patient, as there might be something cooking that can result in a massive bull rally in the coming days. Here’s a look at what’s going on.
ONDO’s latest bullish move
CoinMarketCap’s data revealed that ONDO witnessed a major price drop on the 24th of June. Later, it did go up but couldn’t fully recover as its price was still down by over 4% last week.
At the time of writing, the token was trading at $1.16 with a market capitalization of over $1.6 billion.
AMBCrypto’s look at IntoTheBlock’s data revealed that long-term holders who have held ONDO for a year have been decreasing their holdings.
To the contrary, cruisers, who have held the token for less than a year, were showing immense interest as their numbers increased.
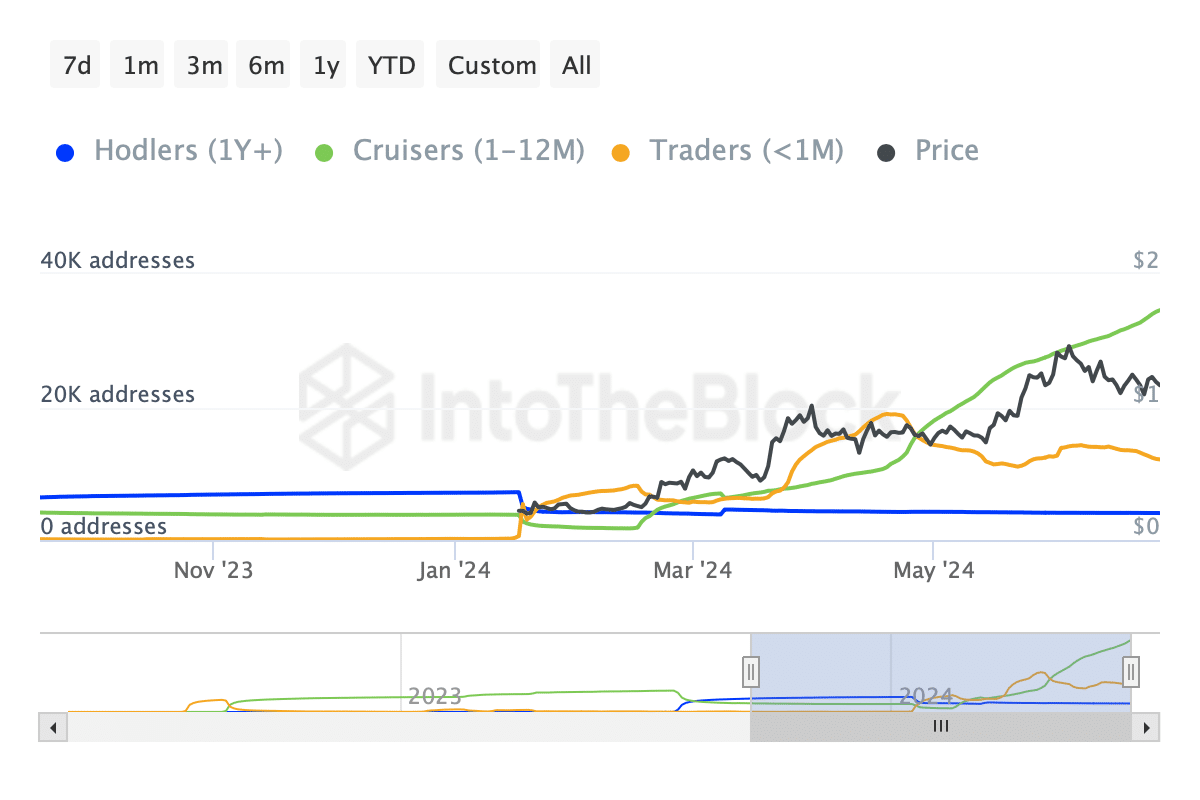
Source: IntoTheBlock
However, long-term holders’ interest in ONDO might shoot up too, as a bullish pattern appeared on the token’s chart.
Captain Faibik, a popular crypto analyst, recently posted a tweet highlighting a falling wedge pattern. The token’s price has been consolidated inside the pattern since the beginning of June, and at press time, it was on the verge of a breakout.
A successful breakout might result in an over-50% price surge. Interestingly, a similar pattern appeared on the token’s chart back in March. ONDO broke out above the pattern in April, sparking a rally that ended at the beginning of June.

Source: X
Will ONDO test the bull pattern?
Since there were chances of yet another bull rally, AMBCrypto assessed Santiment’s data.
As per our analysis, the token’s volume dropped along with its price, which can be inferred as a bullish signal. The token’s MVRV ratio also improved over the last few days.
Additionally, the token’s open interest dropped. Whenever the metric declines, it indicates that the chances of the current price trend changing are high.
Nonetheless, ONDO’s NVT ratio increased, which meant that the token was overvalued, hinting at a continued price decline.
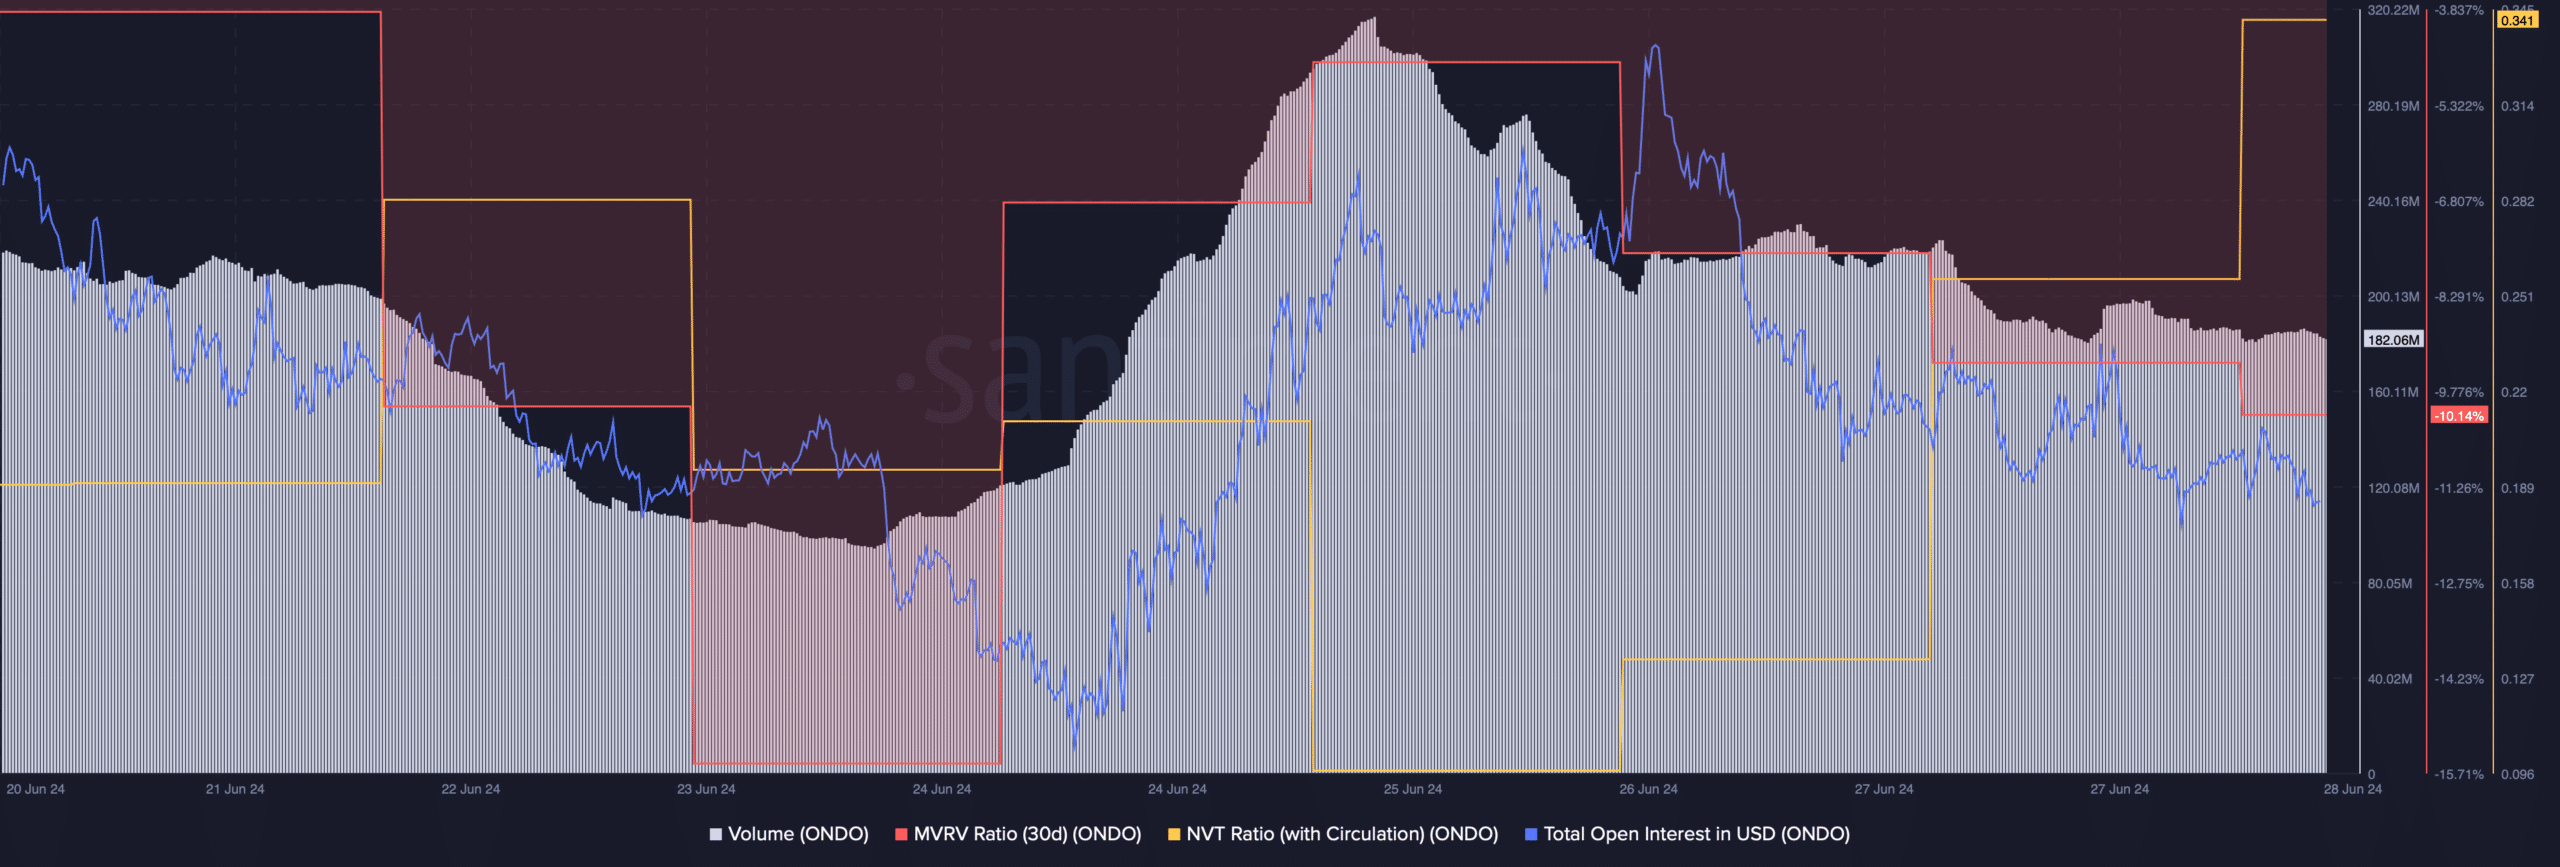
Source: Santiment
We then checked the token’s daily chart to find out whether indicators also suggested a price uptick. The technical indicator MACD displayed a high possibility of a bullish crossover.
Read ONDO’s Price Prediction 2024-25
The Chaikin Money Flow (CMF) registered a slight uptick, indicating a possible price rise.
However, the Relative Strength Index (RSI) was moving sideways at the neutral mark. This meant that there were chances of a few more slow-moving days.
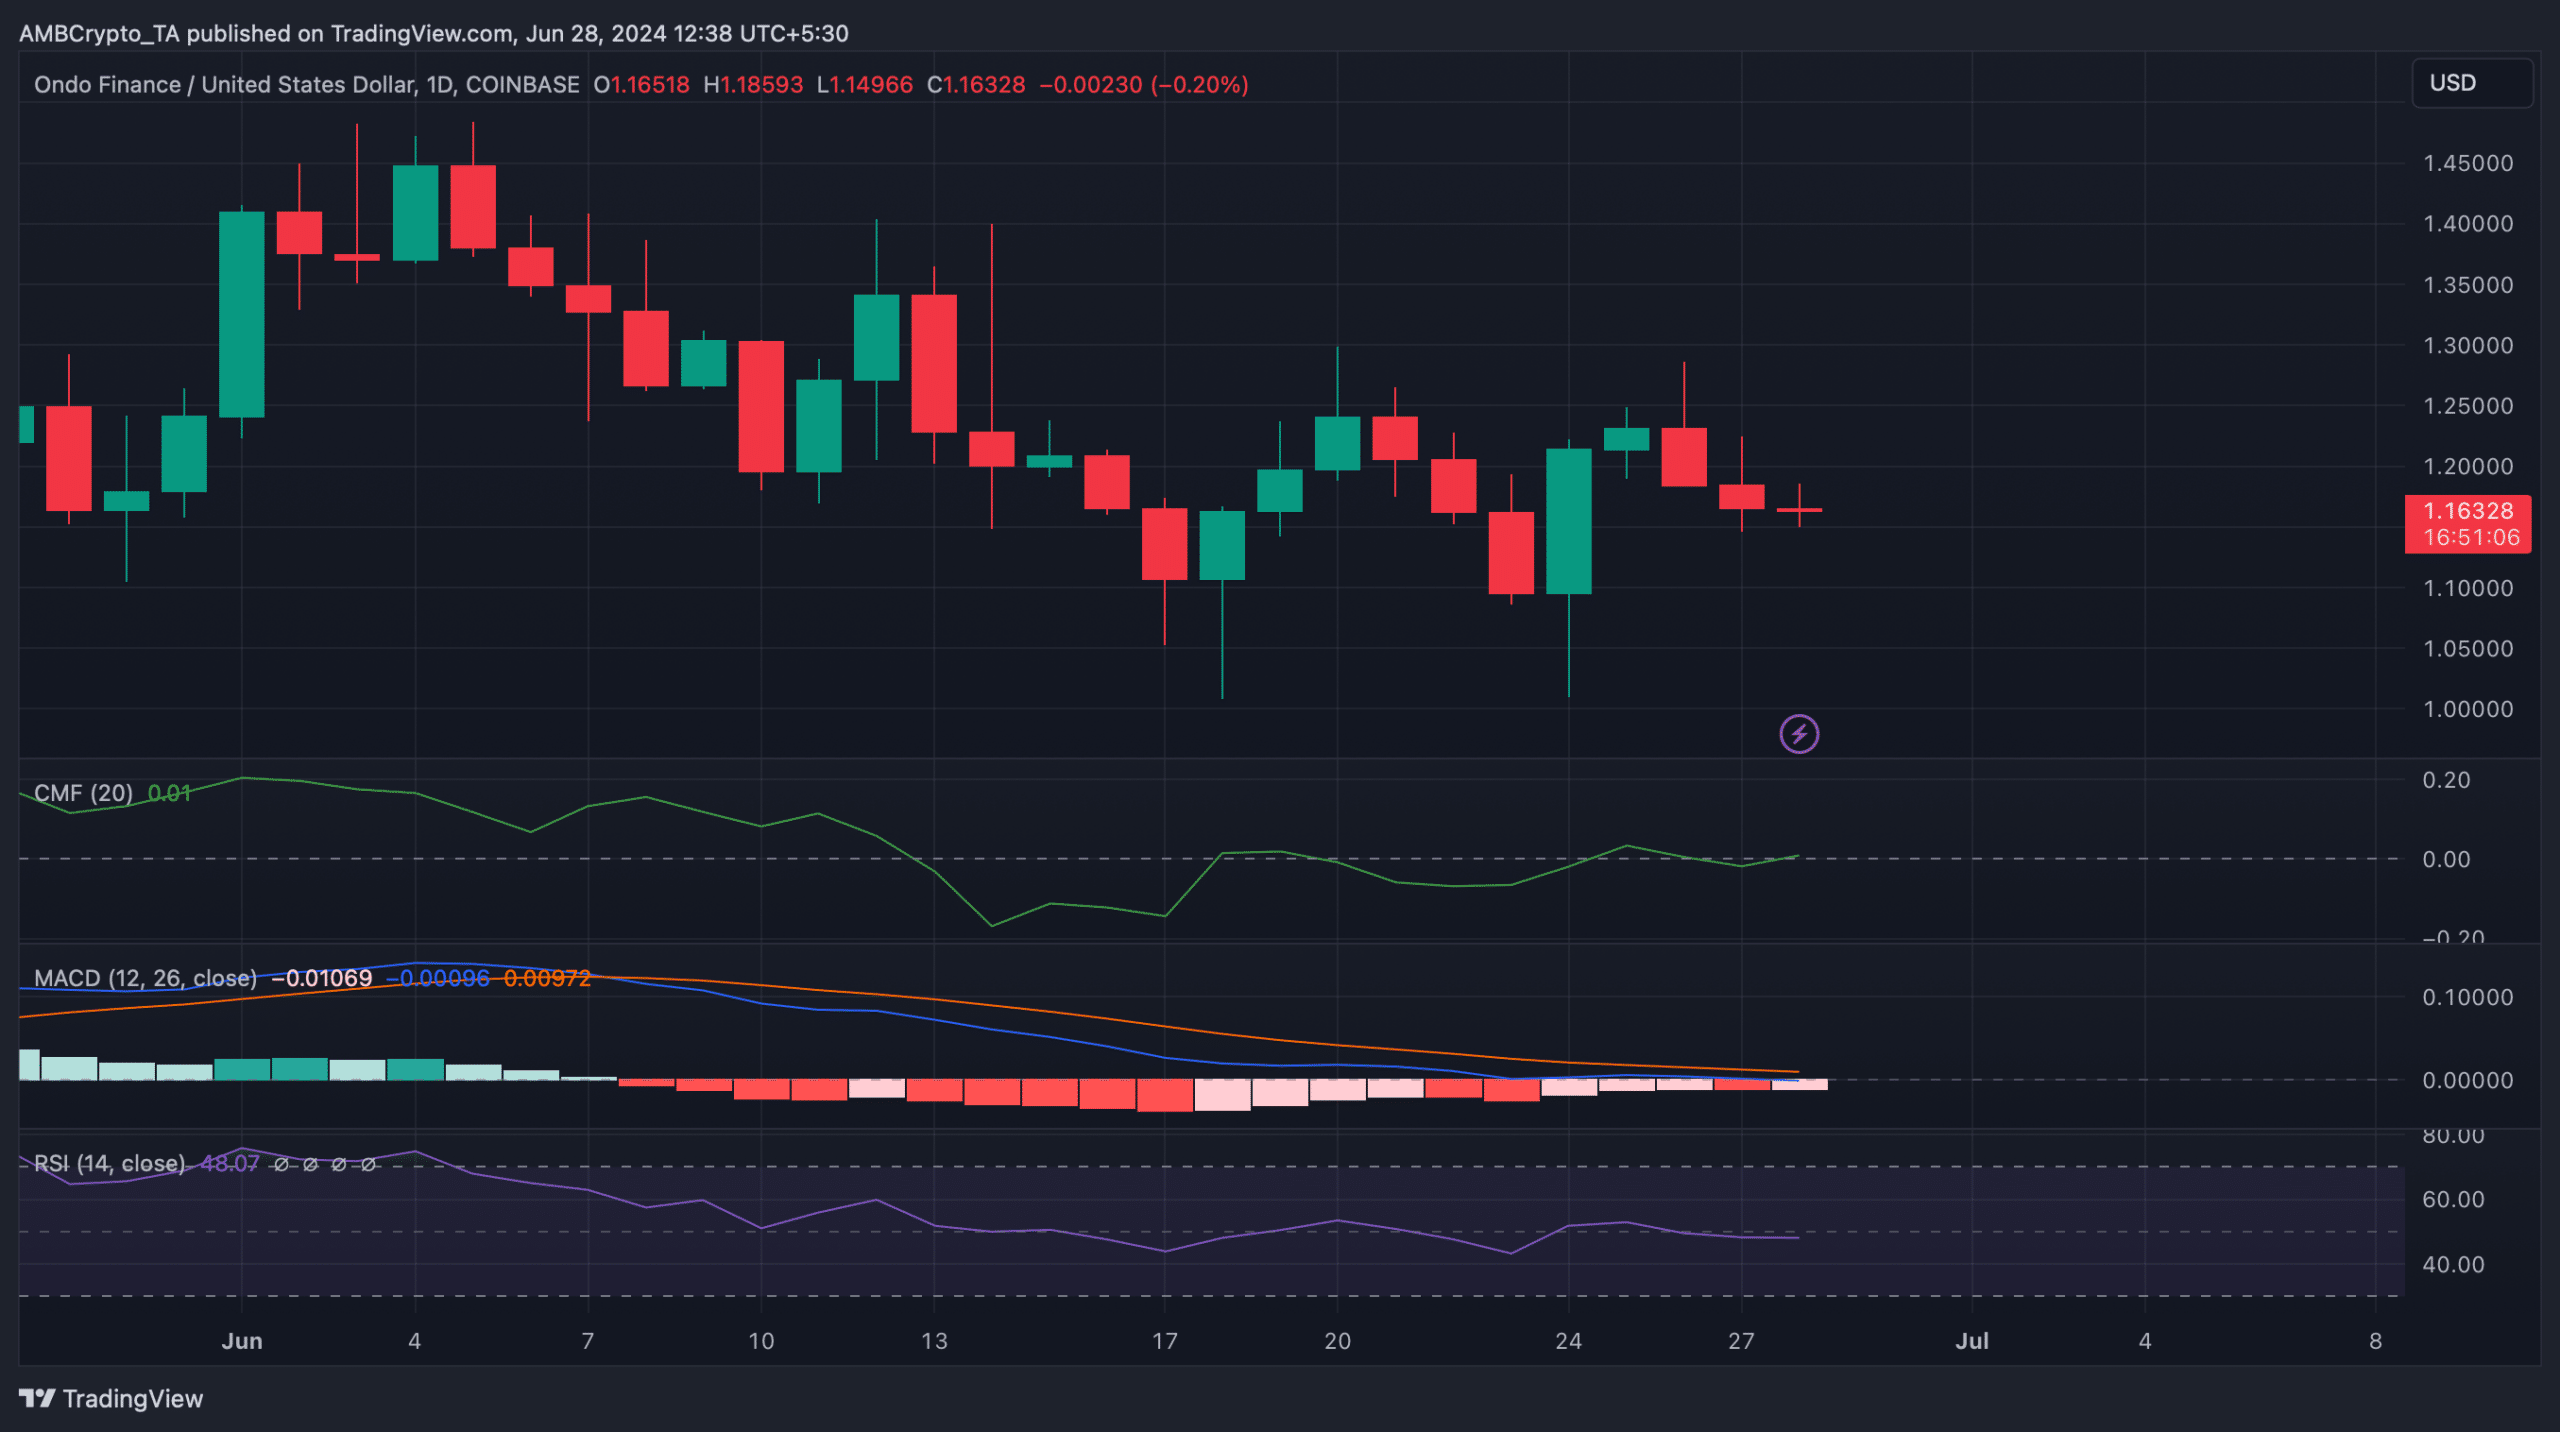
Source: TradingView