
- SHIB’s recovery hit over 20% as bulls aim for further gains.
- But the recovery faced hurdles that could only be bypassed if BTC extended recovery.
Shiba Inu [SHIB] has been up over 20% since May Day, reversing part of the April losses. However, at press time, the memecoin was yet to flip its market structure bullish on the higher timeframe charts.
It faced a double roadblock near the 50% Fibonacci retracement level. Can bulls clear the hurdles and reverse the remaining Q1 losses?
Can bulls bypass sellers eyeing the 50% Fib level?
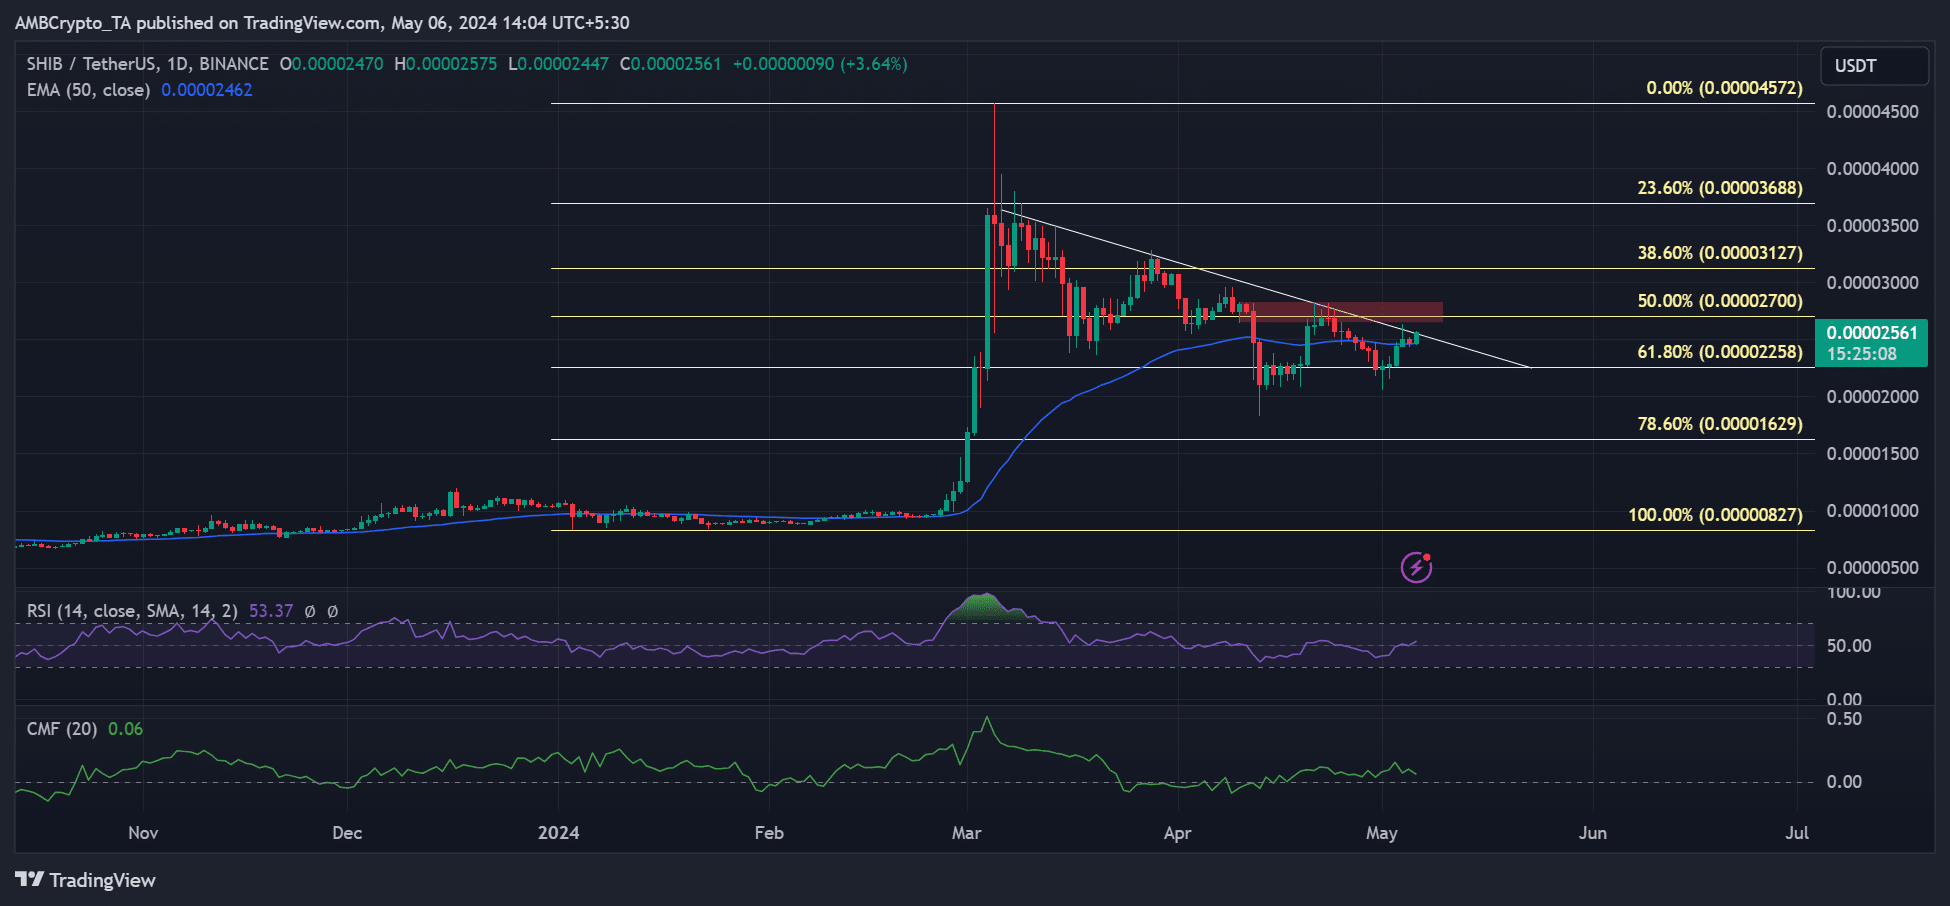
Source: SHIB/USDT on TradingView
On the daily chart, a Fibonacci retracement tool was plotted between January lows and Q1 highs. Based on the tool, the price level of $0.00000270 was crucial.
It was also a 50% Fib placeholder and a daily bearish order block (OB). So, it could act as a significant sell wall.
A trendline resistance was also below the potential sell wall (marked red). But, the RSI (Relative Strength Index) and CMF (Chaikin Money Flow) had neutral readings.
These meant weak buying pressure and low capital inflows that could complicate SHIB’s recovery at $0.0000270.
However, the sell-wall was also the neckline of a double-bottom pattern—a typical bullish reversal formation.
To gain an edge, bulls must clear the double roadblock. Additionally, the market structure must be flipped to bullish by decisively reclaiming above $0.0000270.
Should the bulls prevail, the $0.000031 will be the immediate target.
However, a strong price rejection at the double roadblock could tip sellers to drag SHIB to $0.0000225 again.
Are market players negative on SHIB’s price?
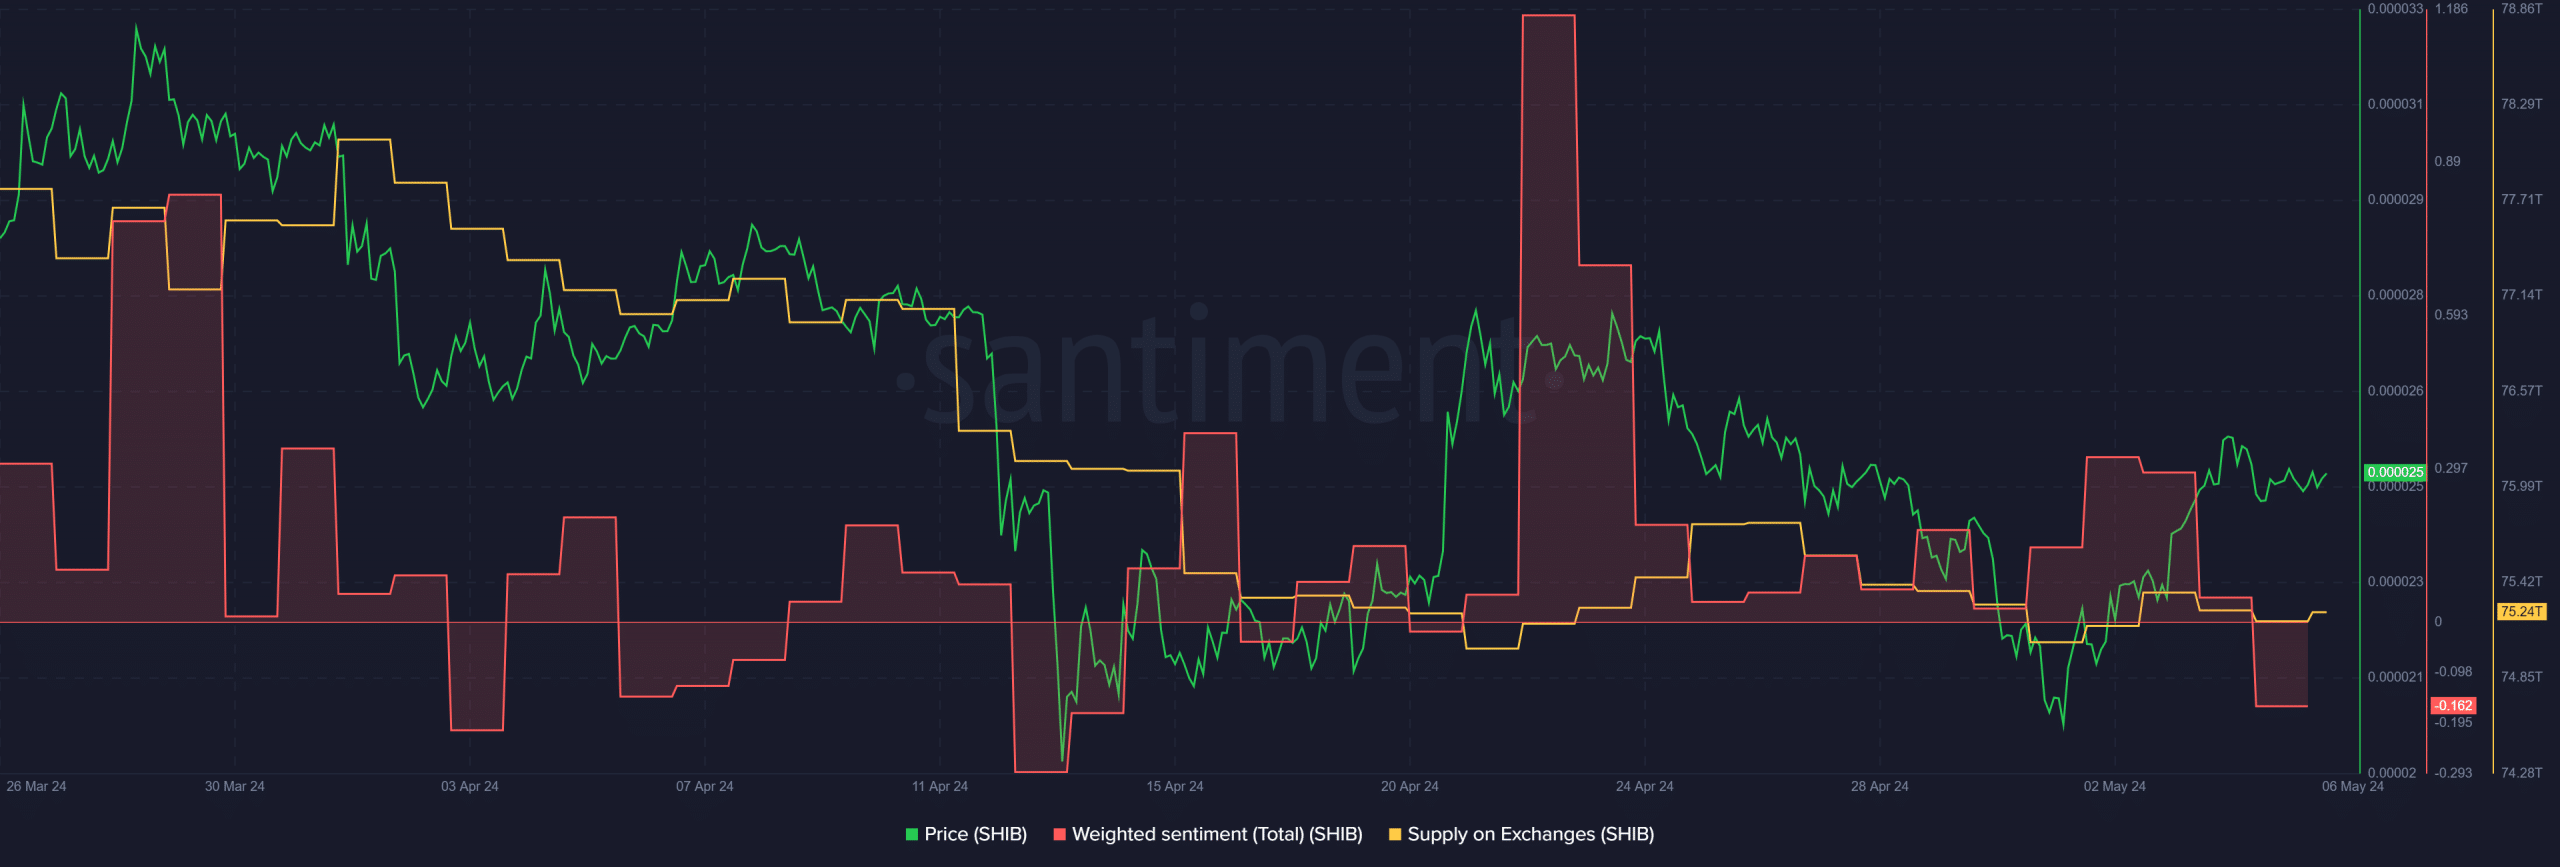
Source: Santiment
The recent recovery was accompanied by positive sentiment on the memecoin.
However, as shown by the Santiment data, the sentiment dipped into negative territory, underscoring potential bearish bets against SHIB’s price.
Additionally, there was a slight uptick in sell-pressure, as shown by the easing drop in the Supply on Exchanges metric (orange).
The metric tracks SHIB’s flow into exchanges, and a positive reading indicates a surge in inflow and potential sell pressure.
Read Shiba Inu’s [SHIB] Price Prediction 2023-24
On the contrary, a drop in the Supply on Exchange denotes outflows from exchanges – a potential buying pressure signal.
However, Bitcoin’s [BTC] extended recovery above $65K could drag SHIB bulls to crack the neckline resistance. Hence, tracking BTC’s price action could be crucial to gauge SHIB’s next move.