
- FOMO around Solana has increased substantially in the last few days.
- Fear and greed index hinted at a price correction
Solana [SOL] investors were rejoicing after multiple days of bearish price movement as the token’s weekly and daily charts turned green. However, investors must continue to practice caution, as FOMO around the token might put an end to this recently initiated bull rally.
Solana investors enjoy profits
CoinMarketCap’s data revealed that Solana’s price surged by more than 9% in the last seven days. In the last 24 hours alone, the token’s value increased by over 4%, allowing it to once again touch $145.
However, at press time, SOL’s price witnessed a slight correction as it was trading at $144.8 with a market capitalization of over $67 billion.
Thanks to the recent price uptick, market sentiment around the coin turned bullish, which was evident from the massive spike in its weighted sentiment.
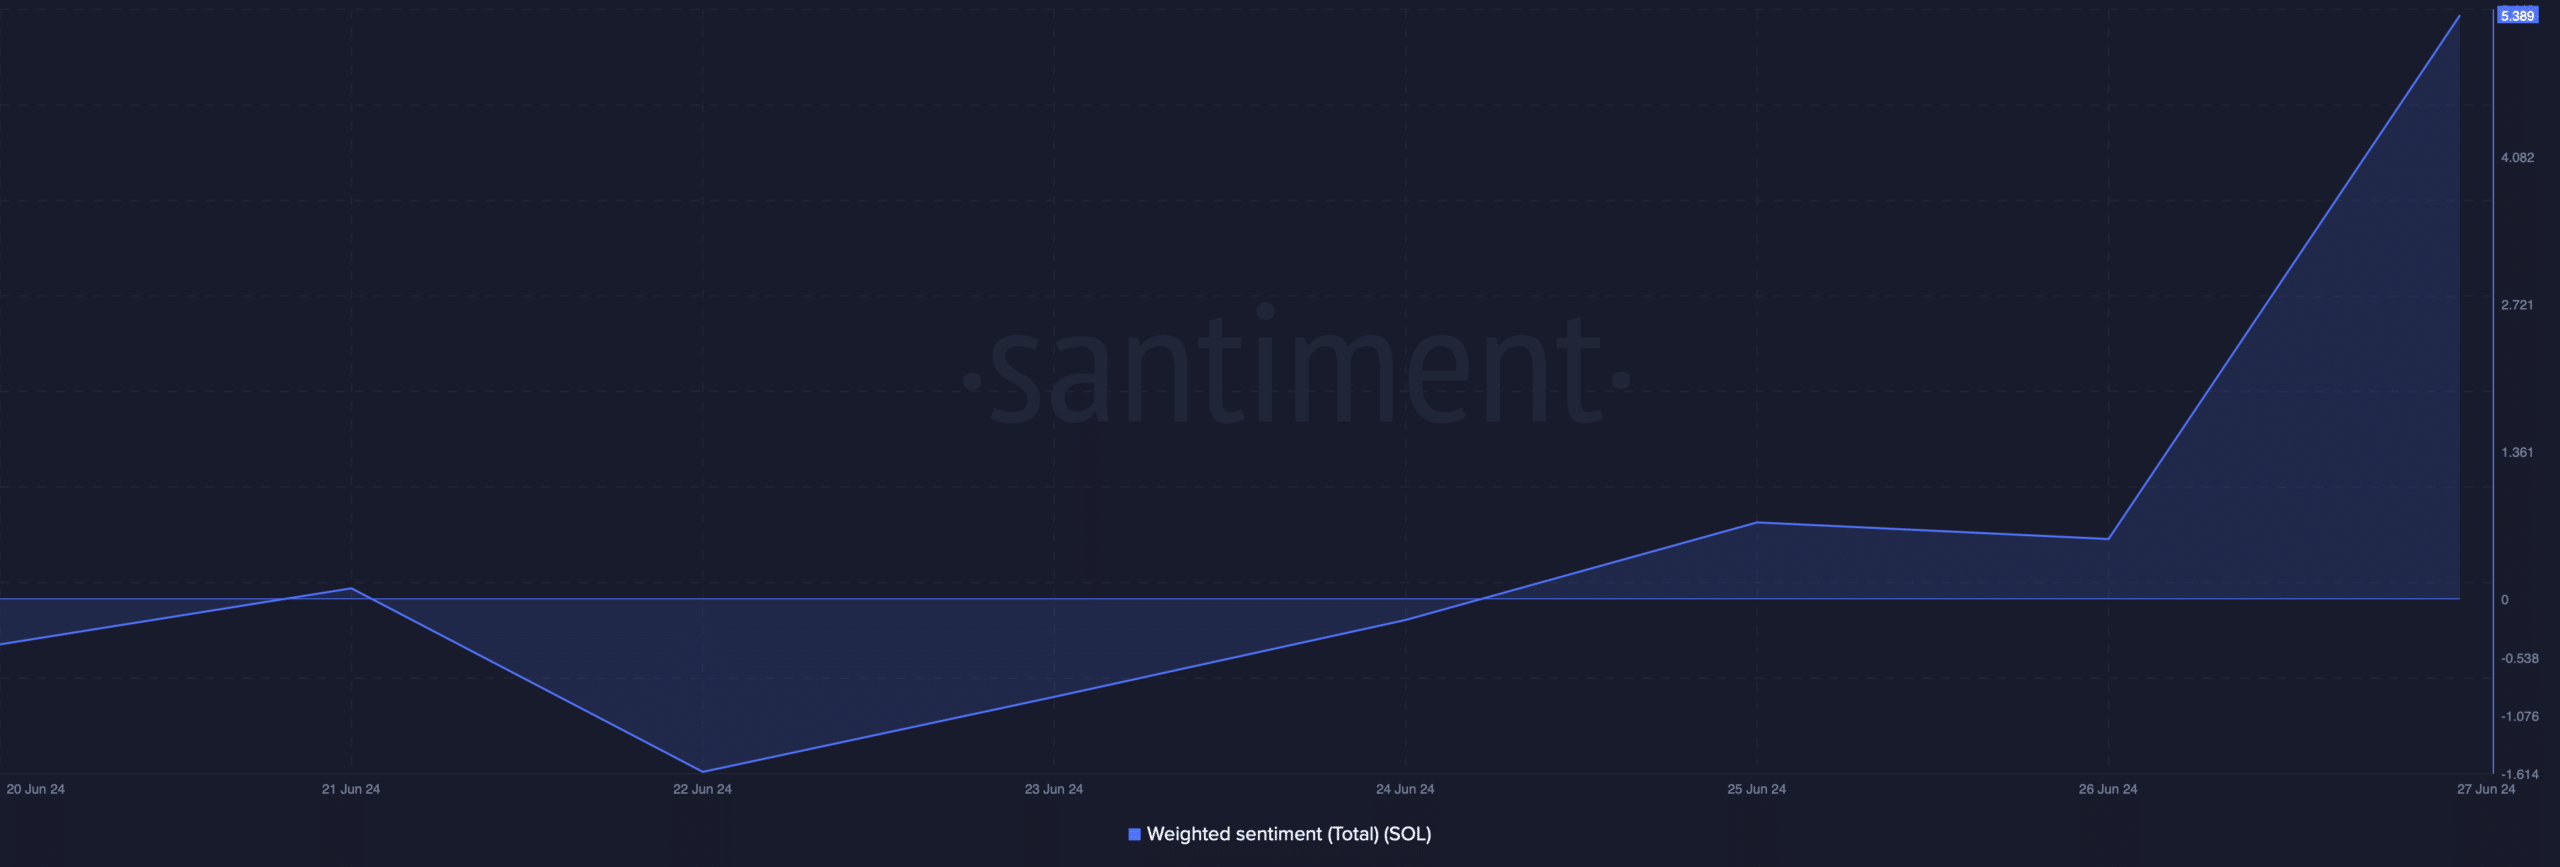
Source: Santiment
However, though the aforementioned data looked optimistic, Santiment’s recent tweet pointed out a development that might cause trouble for Solana.
As per the tweet, while SOL’s price gained bullish momentum, FOMO around it also increased. Generally, a rise in FOMO amidst a price increase often puts an end to the bull run.
It was interesting to know that Avalanche [AVAX] also showcased a bullish rally along with SOL. The good news for AVAX was that FOMO around it didn’t rise much.
Will SOL’s bull rally last?
Since there were chances of SOL’s bull rally ending, AMBCrypto checked its on-chain data to better understand what to expect.
Our analysis of Coinglass’s data revealed that SOL’s long/short ratio increased. A rise in the metric is usually considered a positive signal, as it indicates that bullish sentiment around an asset is high.

Source: Coinglass
However, Solana’s fear and greed index had a reading of 63% at press time, meaning that the market was in a “greed” phase. Whenever the metric touches this level, it indicates that the chances of a price correction are high.
The Bollinger Bands’ revealed that SOL’s price was entering a less volatile zone. Additionally, the Relative Strength Index (RSI), after a sharp rise, registered a decline, indicating that Solana’s might soon witness a price drop.
The Chaikin Money Flow (CMF), on the other hand, continued to move northward. The MACD displayed a clear bullish crossover, hinting at a continued price surge.
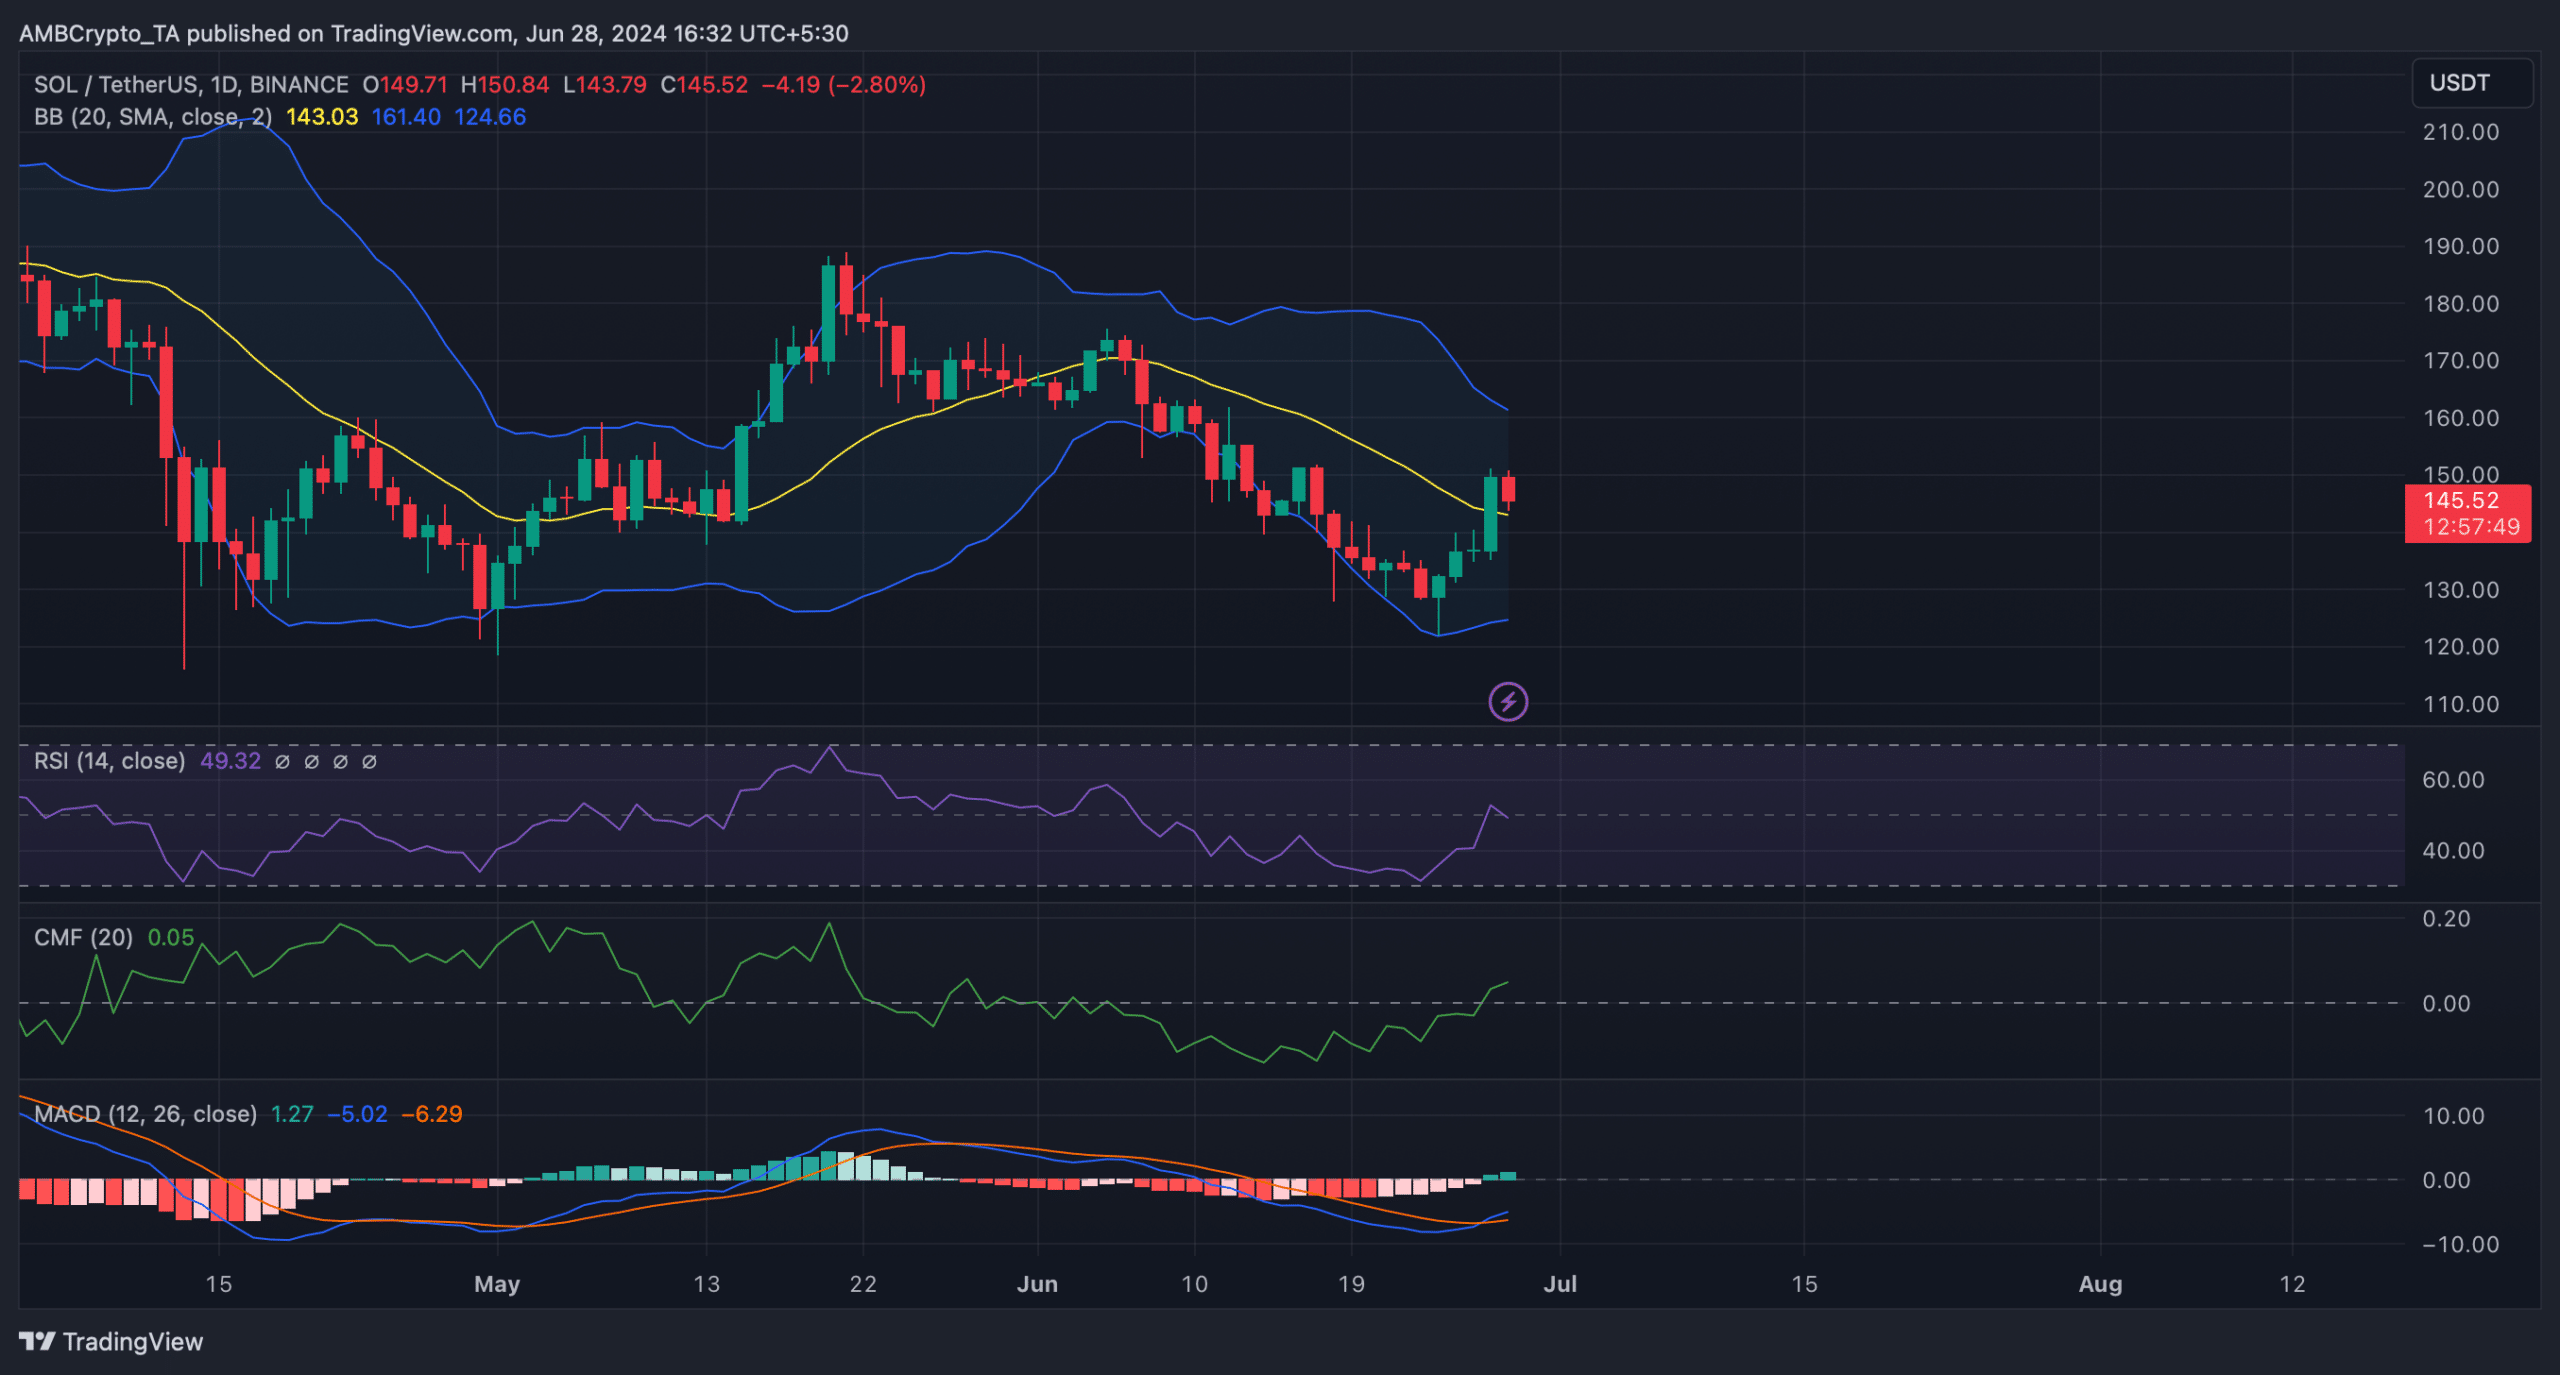
Source: TradingView
Is your portfolio green? Check out the SOL Profit Calculator
Our analysis of Hyblock Capital’s data revealed that if the bull rally continues, then it won’t be surprising to see SOL go above $150 in the coming days.
However, a correction might result in a drop to $141.

Source: Hyblock Capital