- Solana’s NFT sales volume and transactions dipped last month.
- SOL’s price action remained bearish, and indicators suggested a further price drop.
Solana [SOL] witnessed a year-long summer in its NFT ecosystem as the blockchain outperformed its competitors. However, Solana’s NFT metrics started to decline in the past month. Meanwhile, the token’s price action also turned bearish.
Solana’s NFT ecosystem is shining bright
SolanaFloor, a popular X handle that posts updates related to the blockchain, posted a tweet highlighting SOL’s commendable performance.
As per the tweet, SOL outperformed every other chain, including Bitcoin [BTC], Ethereum [ETH], and Polygon [MATIC], in yearly NFT blockchain user adoption.
While SOL’s number of users grew by 33% in the past 365 days, MATIC, BTC, and ETH’s users grew by 29%, 10%, and 21%, respectively.
AMBCrypto’s look at DappRadar’s data revealed that MadLads, Frogana, and Sharx by sharky.fi were the top NFT collections on Solana, which might have contributed towards the aforementioned achievement.
Despite promising 365-day growth, things started to change in the last month. AMBCrypto’s look at Cryptoslam’s data pointed out that SOL’s NFT sales volume dropped by over 36% last month, as did its total number of buyers and sellers.
Its total NFT transactions also dipped by 11%. Santiment’s data also corresponded to this, as SOL’s NFT trade count sank sharply over the past month.
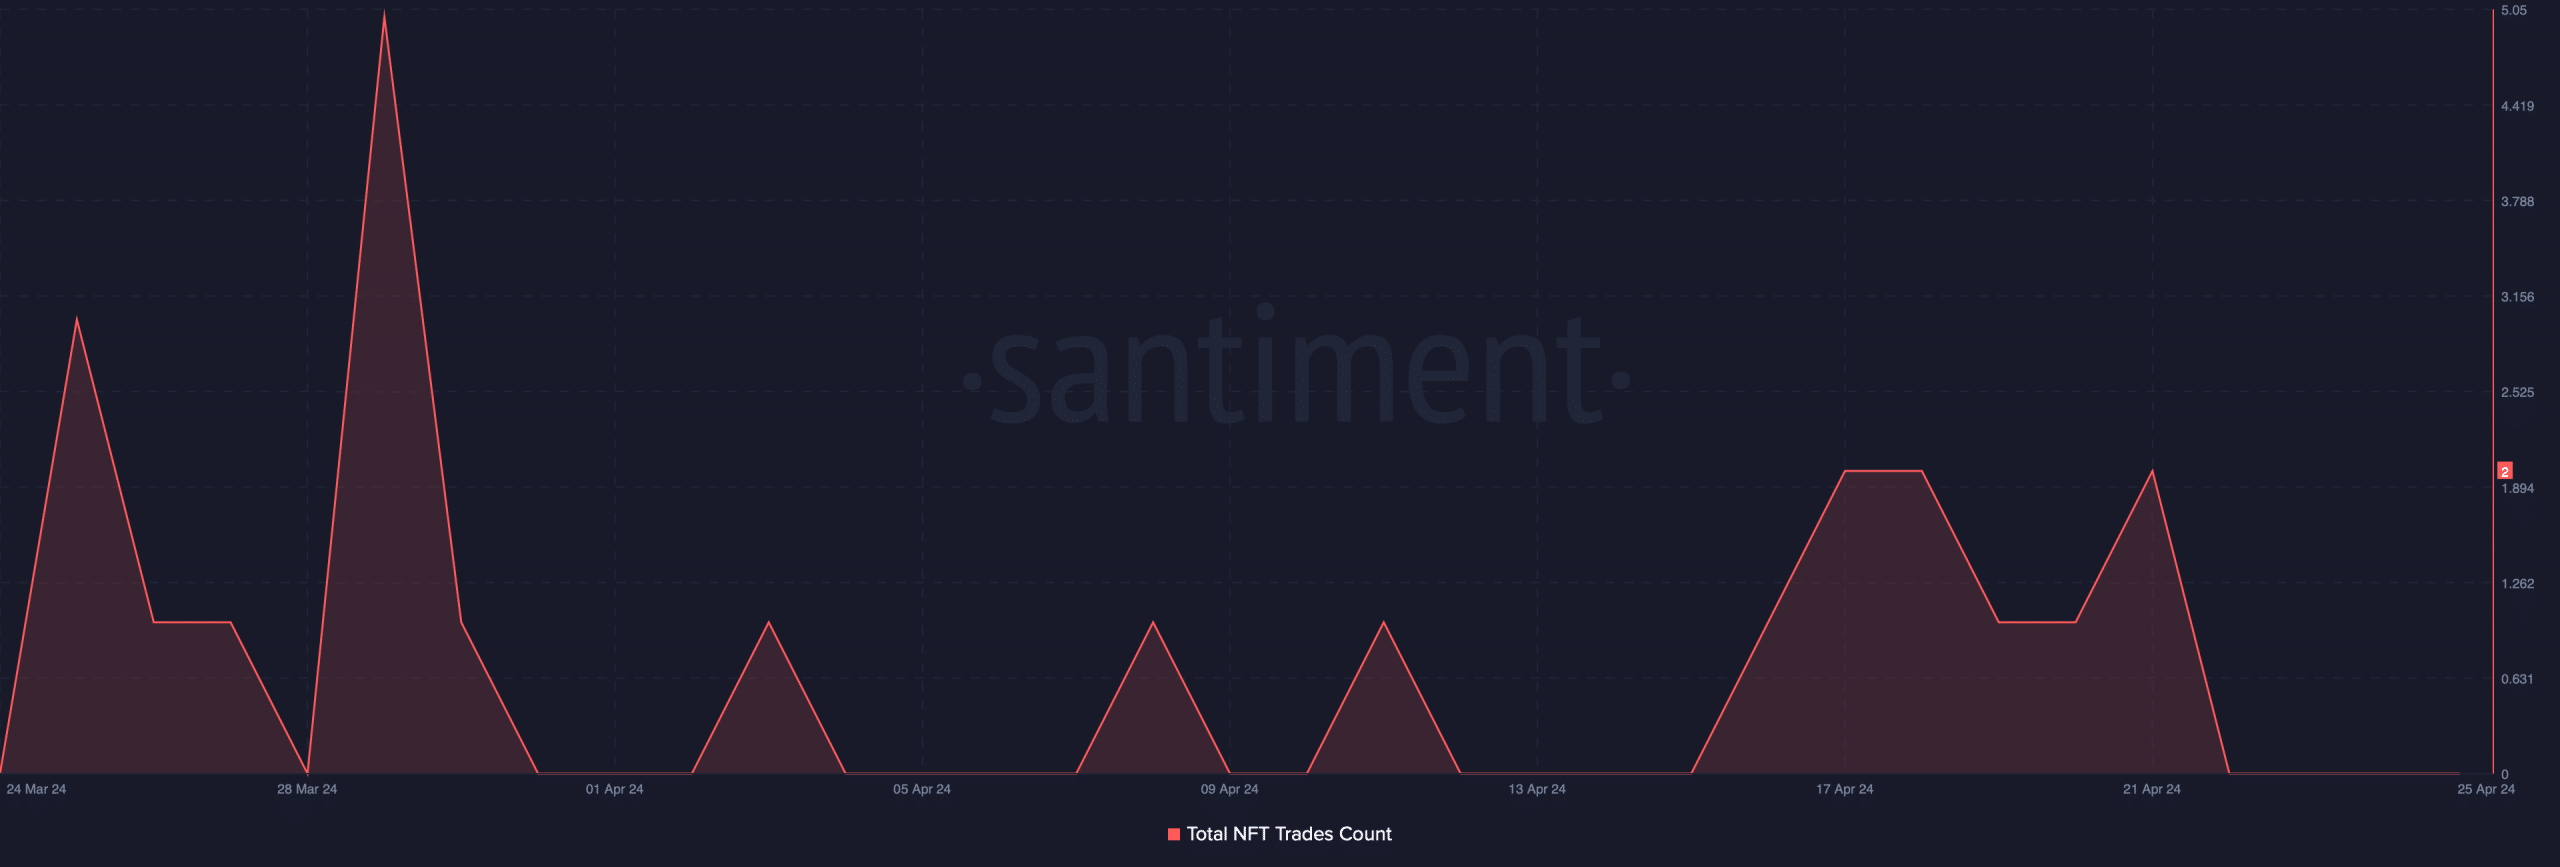
Source: Santiment
Solana investors need to worry
While Solana’s NFT metrics dipped, the token’s price action also turned bearish. According to CoinMarketCap, SOL was down by over 25% last month.
In fact, in the last 24 hours alone, the token’s value dropped by 7%. At the time of writing, SOL was trading at $145.55 with a market capitalization of over $65 billion, making it the 5th largest crypto.
The decline in price also took a toll on the token’s social metrics. SOL’s social volume declined over the past month, reflecting a decrease in its popularity in the crypto space.
Additionally, Solana’s weighted sentiment also remained in the negative zone for the majority of the days. This clearly suggested that bearish sentiment around the token was dominant in the market.
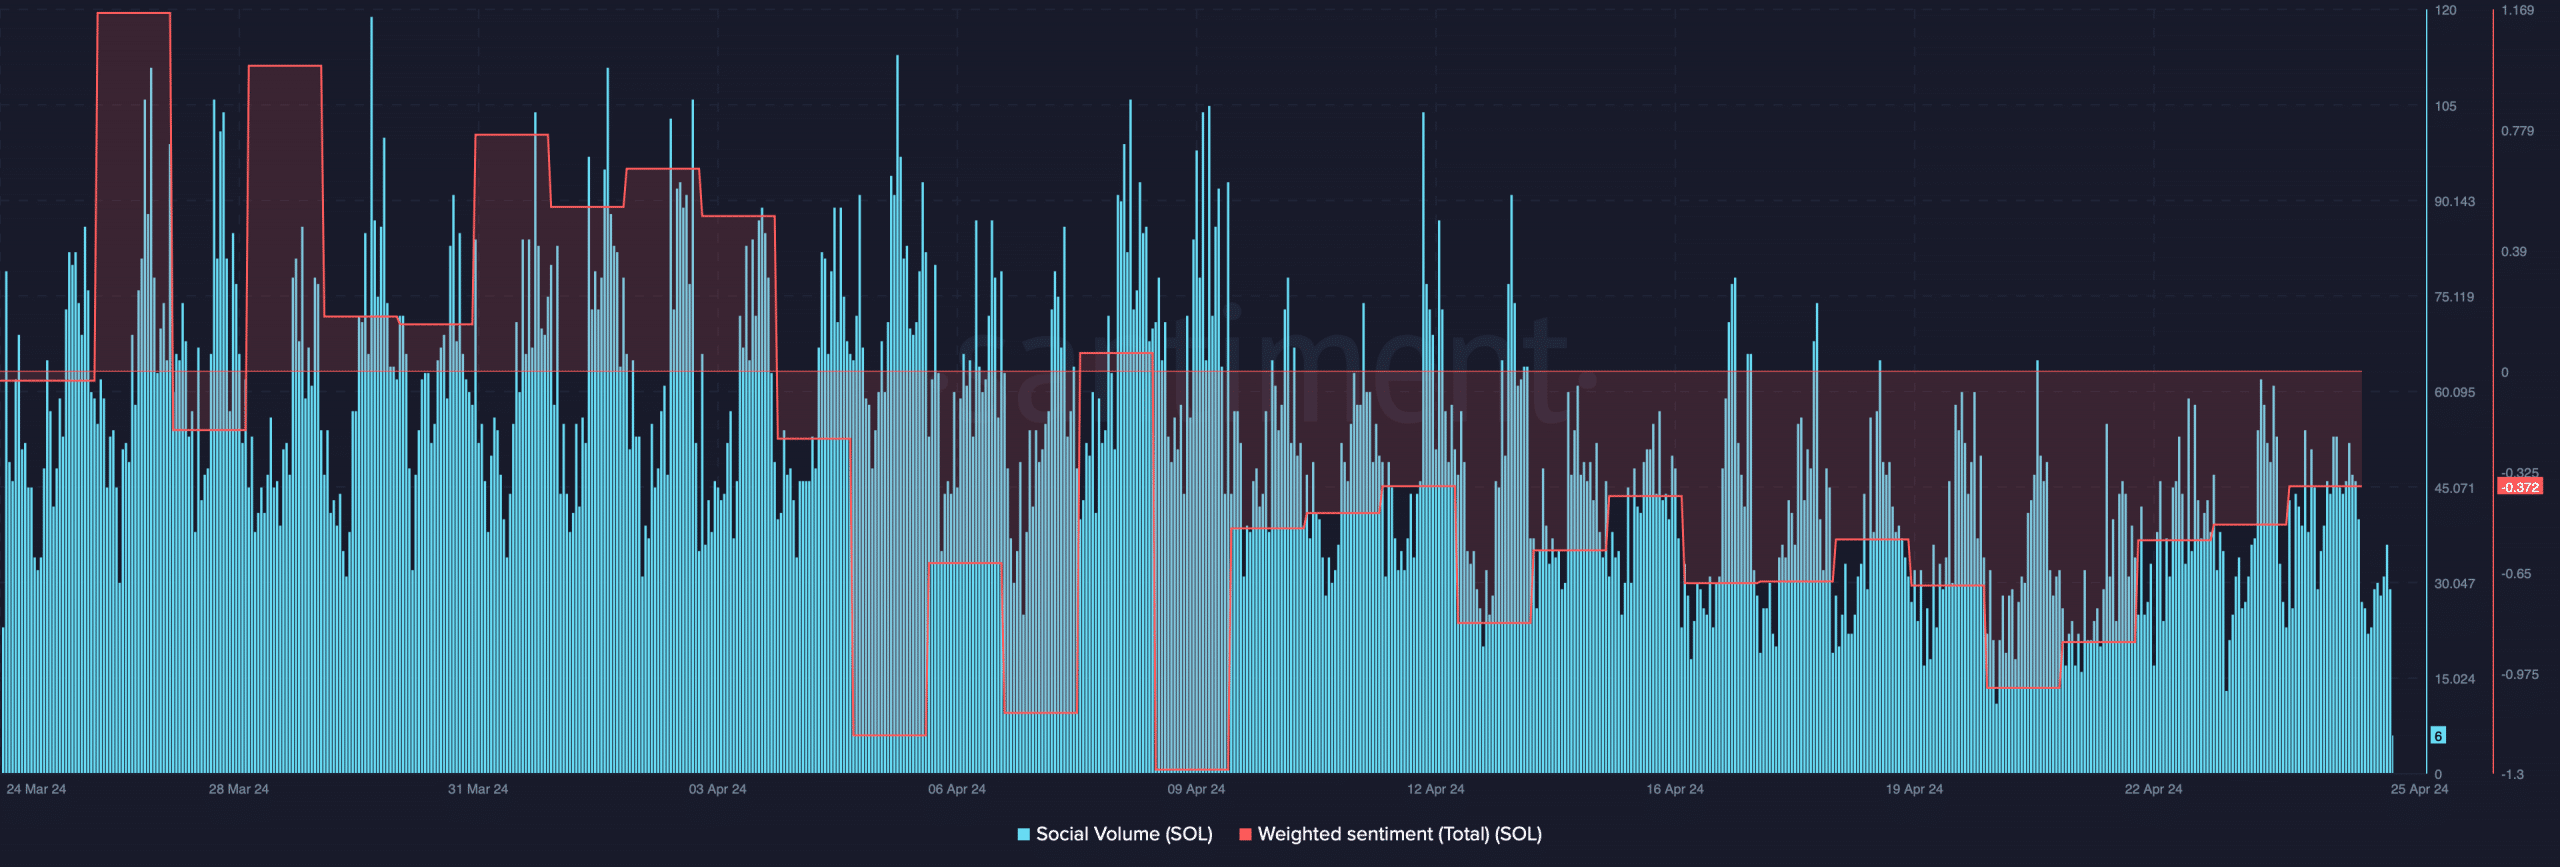
Source: Santiment
AMBCrypto then analyzed the token’s daily chart to find whether this bearish price trend would continue longer. We found that both SOL’s Relative Strength Index (RSI) and Money Flow Index (MFI) started to decline and were headed further below their respective neutral marks.
Read Solana’s [SOL] Price Prediction 2024-25
Additionally, the token’s price also failed to go above its 20-day Simple Moving Average (SMA), as suggested by the Bollinger Bands.
All these technical indicators hinted that investors might witness a further drop in SOL’s price in the coming days or weeks.
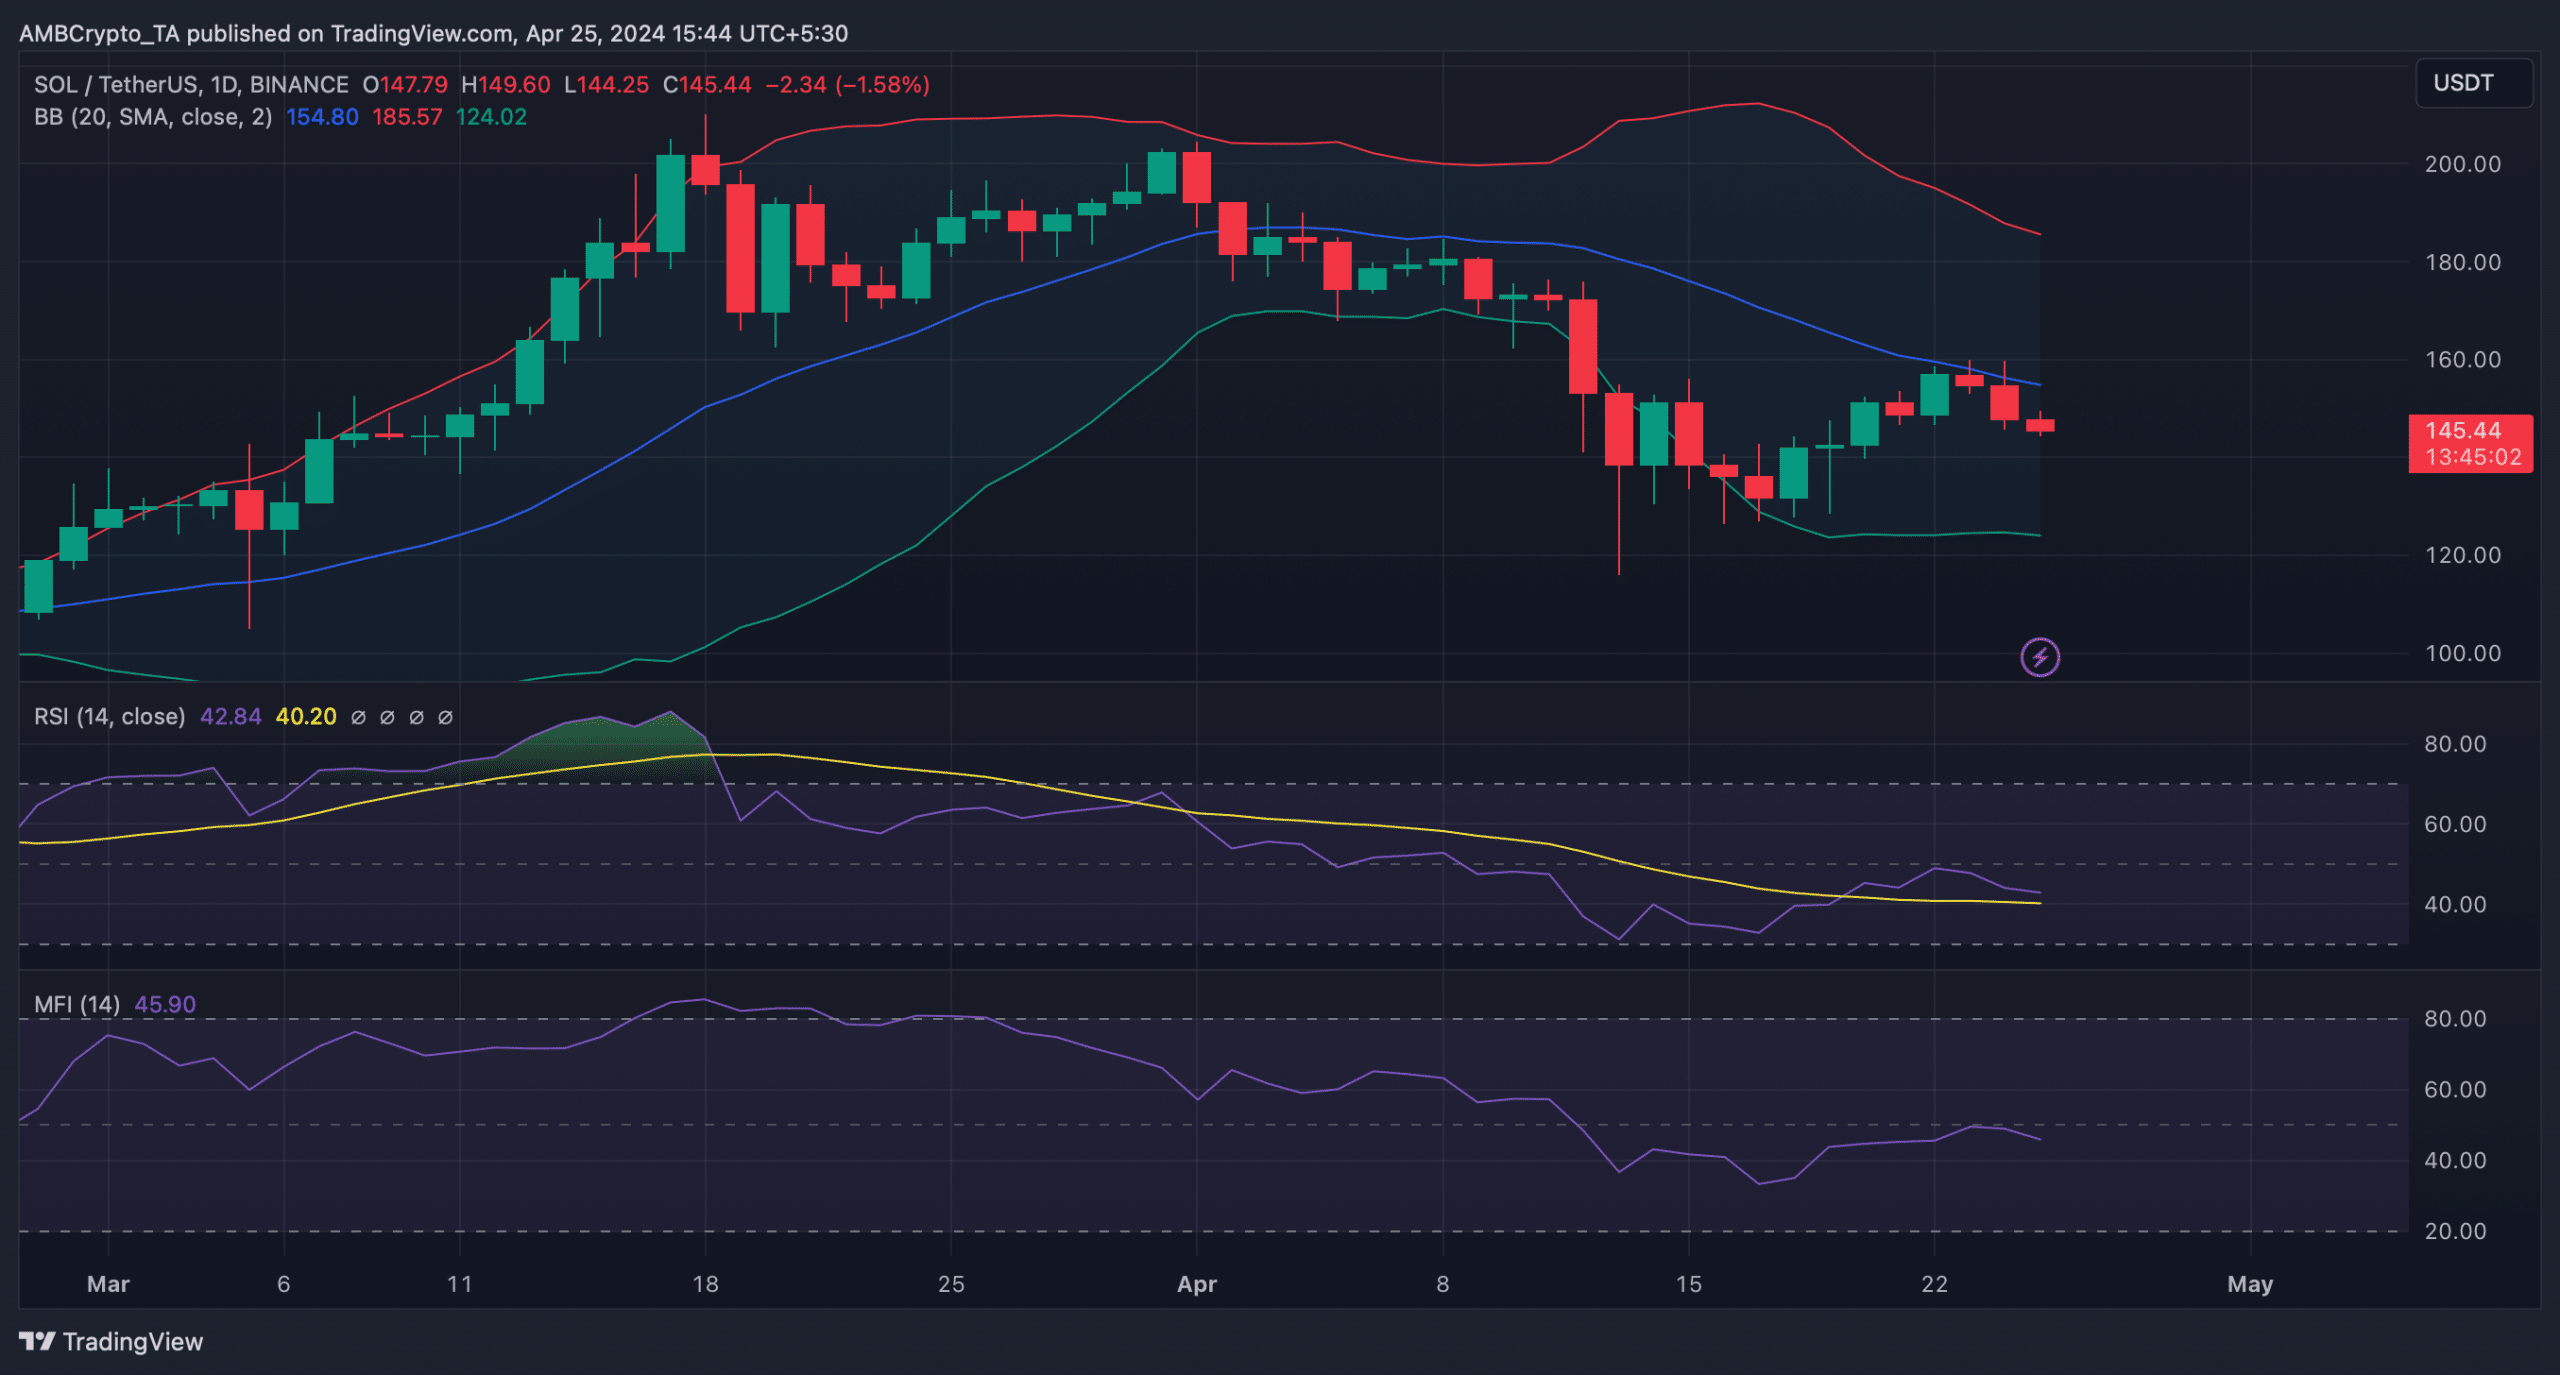
Source: TradingView