
- The TON divergence did not see a deep retracement due to heavy demand.
- There was a chance of a short-term reset for Toncoin prices.
Toncoin [TON] is on a stellar run, gaining 28% in just over a day. In doing so, it also broke a key resistance level at $5.5 and established a bullish continuation on the price chart.
AMBCrypto’s technical analysis showed that while the long-term outlook was bullish for Toncoin, the futures market was overheated. There could be a flush of overleveraged futures speculators shortly.
The breakout occurred on high trading volume, bolstering bullish confidence
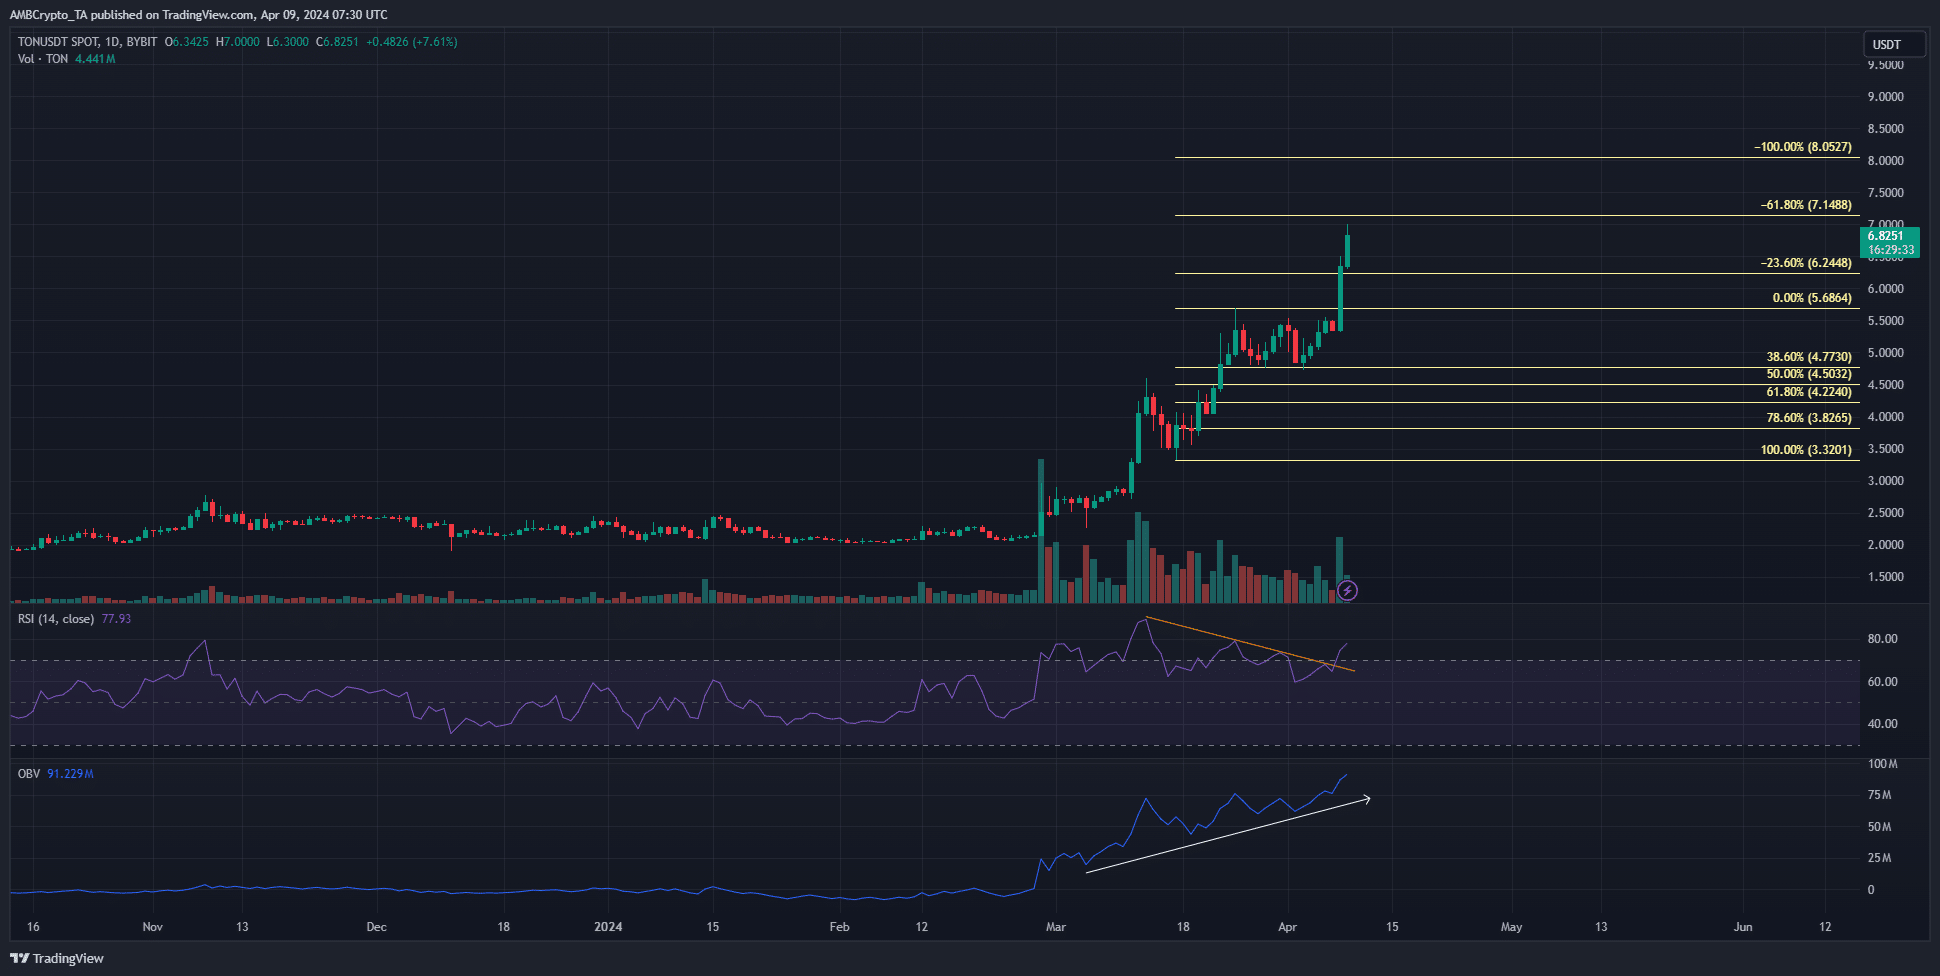
Source: TON/USDT on TradingView
Toncoin has a strongly bullish bias on the one-day chart. It also saw a surge in trading volume when it broke out past the $5.68 level. In the past two weeks, the $5.55 level has been a local resistance for TON.
The RSI had also formed lower lows throughout the past month (orange) while the price tried to push higher. This bearish divergence did not see prices dip below the $4.77 level, which was only the 38.6% Fibonacci retracement level (pale yellow).
Usually, a retracement reaches the 61.8% or the 78.6% levels. In this instance, the strength of the buyers did not allow for a deeper retracement. This was evident from the rising OBV. The next targets for the bulls are at $7.15 and $8.05.
There were signs of overextension
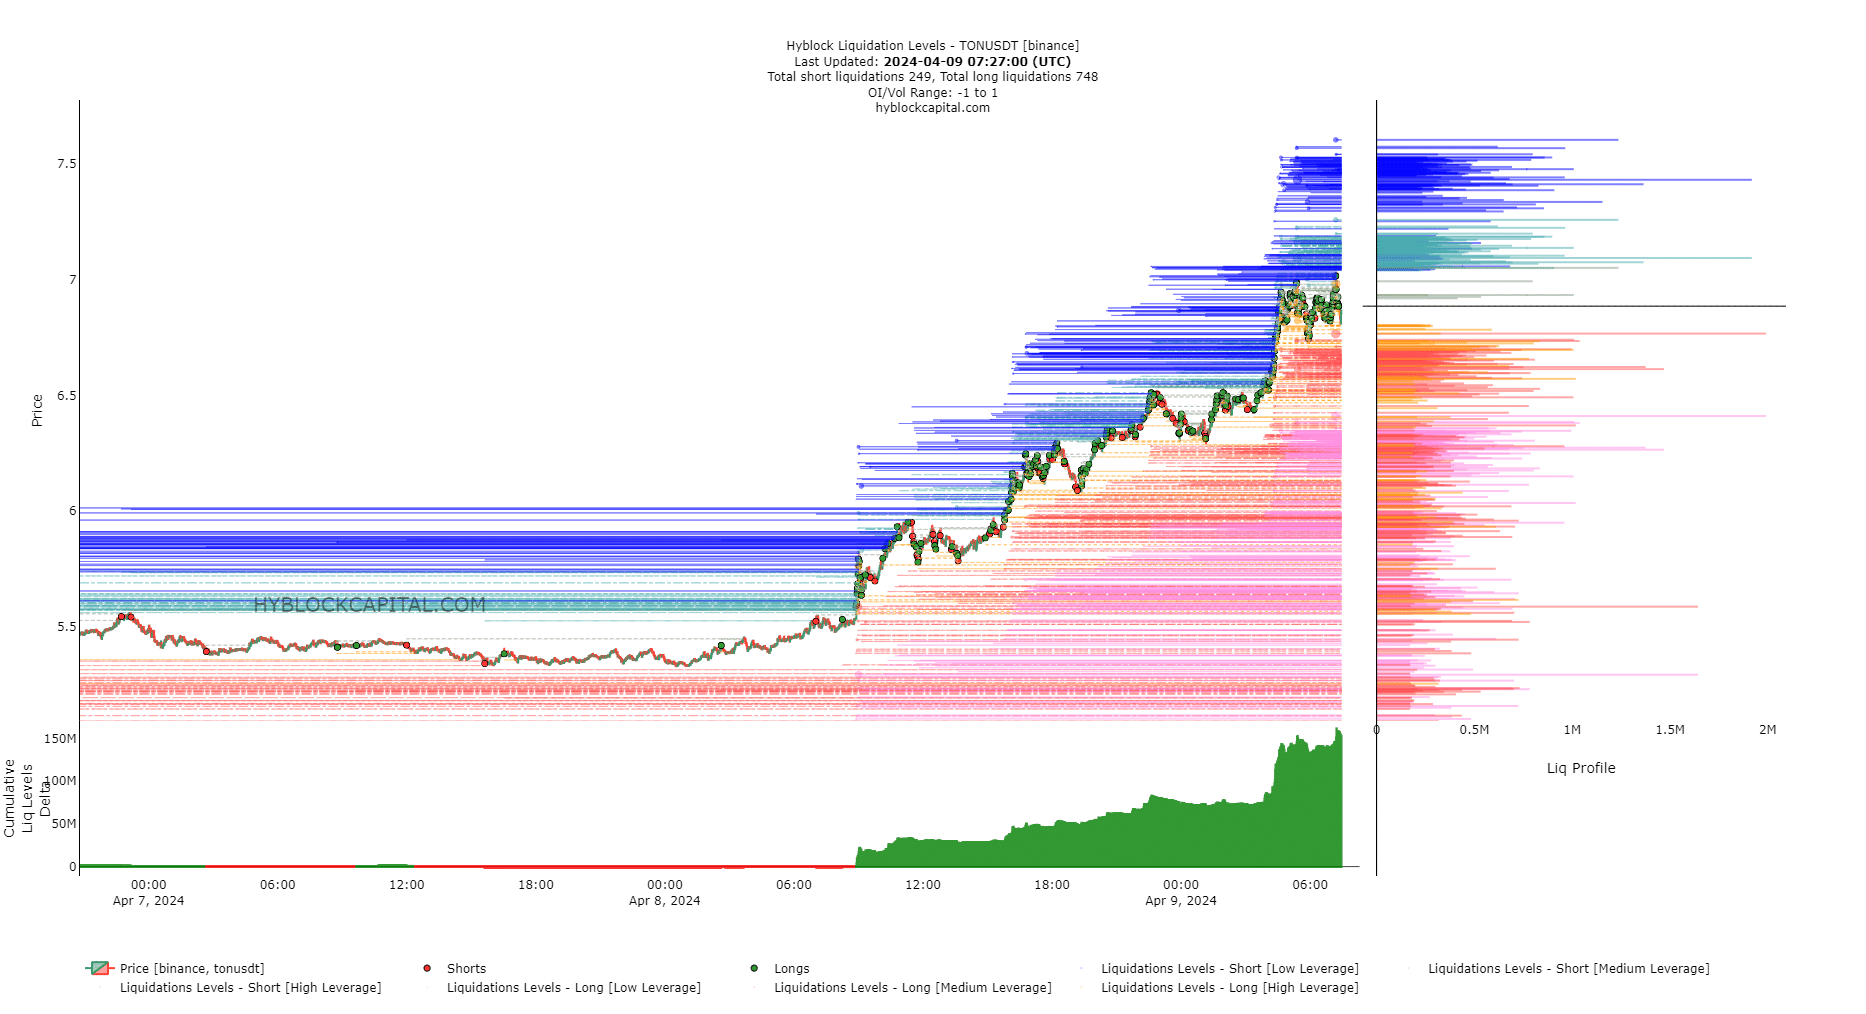
Source: Hyblock
The strong bullish momentum that swept across the crypto market on the 8th of April saw TON burst past the $5.55 resistance and reach $6.4. AMBCrypto noted that the cumulative liquidation levels delta was enormously positive.
This meant that long positions far outweighed the short ones. In turn, this implied that a move downward would lead to much more liquidations, and cause more pain in the market.
Is your portfolio green? Check the Toncoin [TON] Profit Calculator
This could also be a healthy reset of the excess speculative interest behind TON. The liquidation levels chart showed that $7.43 was a level of interest that could be swept before a downturn.
The $6.41 and $6.27 levels could be visited before a bullish reaction.
Disclaimer: The information presented does not constitute financial, investment, trading, or other types of advice and is solely the writer’s opinion.