
- Wormhole shows promise with its high development activity.
- The price action chart revealed a short-term downtrend.
A Santiment post on X (formerly Twitter) revealed that Wormhole [W] had the highest development activity amongst Solana [SOL] ecosystem projects in the past month.
It comfortably surpassed the development activity of Solana and Jupiter [JUP].
Solana has experienced its share of pain in the past few days. The transaction failure rate reached 75% on the 6th and 7th of April, bringing the network to its knees.
The surge in on-chain traffic over the past month, partially fueled by the demand for meme coins, also saw a drop in the daily active user count.
Wormhole’s high development activity was an encouraging development. It also saw a rise in demand in the spot markets.
Comparing Wormhole against Solana and Jupiter
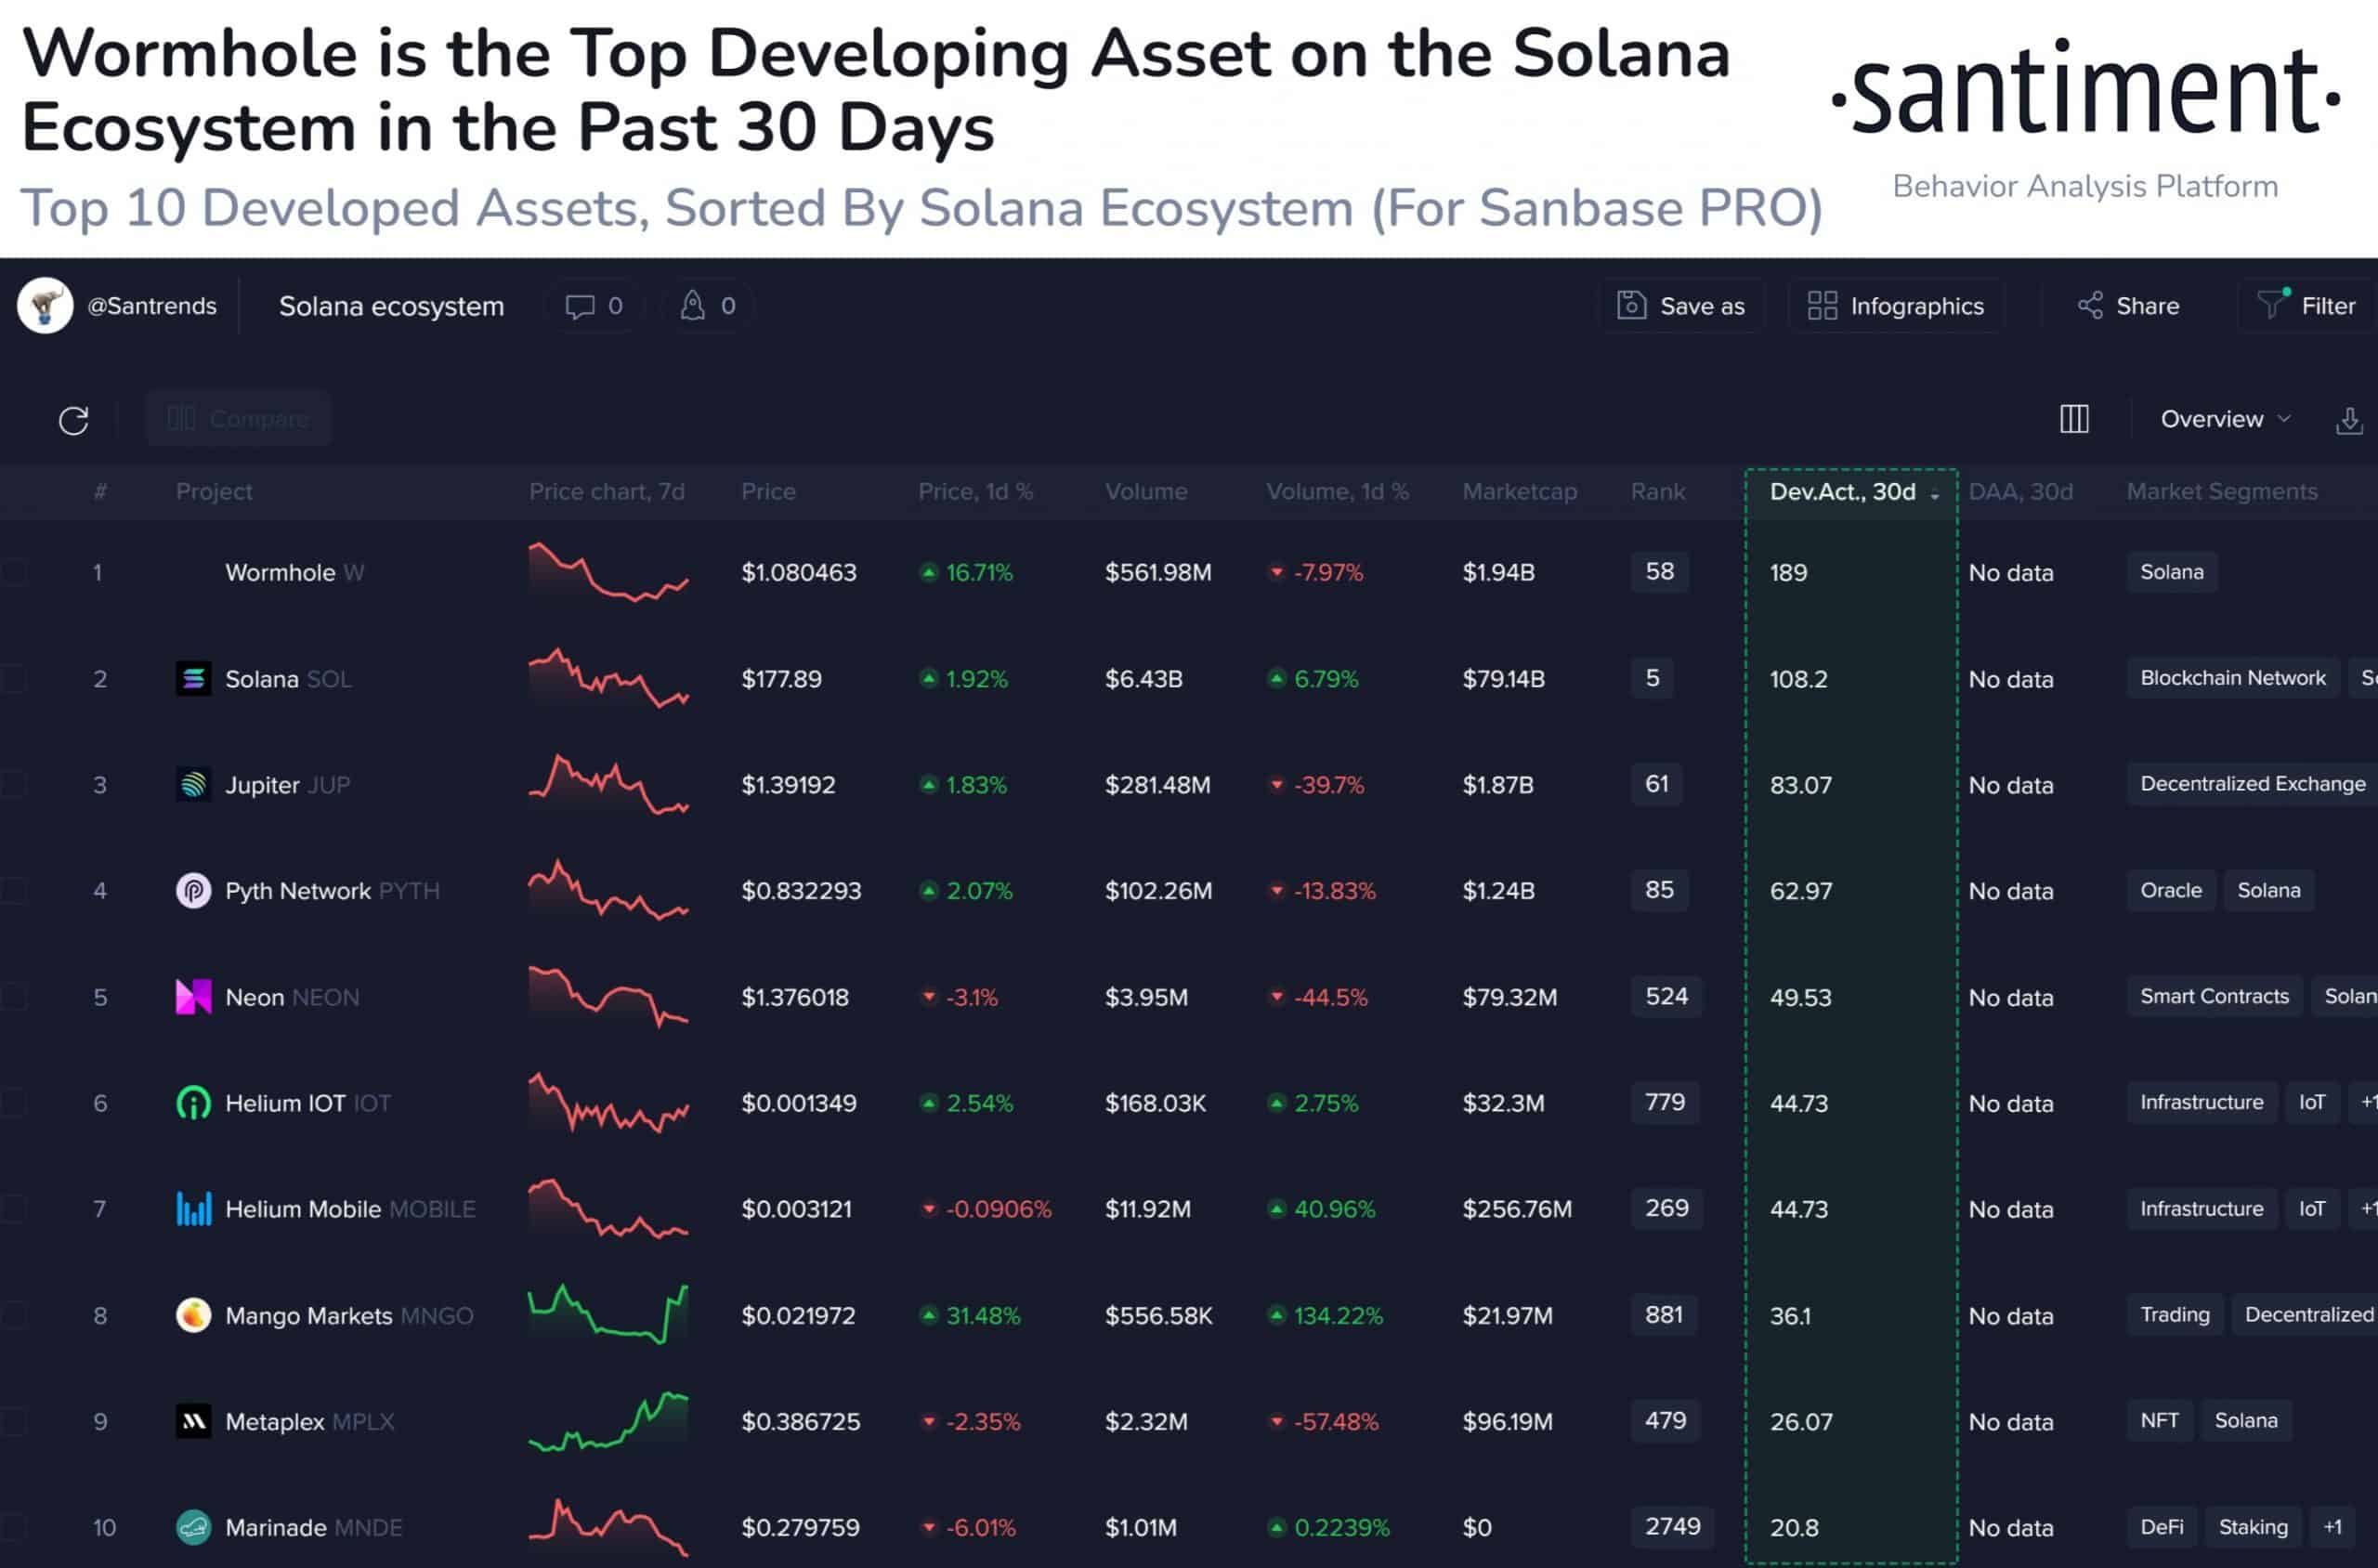
Source: Santiment on X
The 30-day development activity of Wormhole stood at 189. Meanwhile, Solana was at 108.2 and Jupiter at 83.07.
In a Medium post, Santiment explained why tracking events gives a better understanding of development activity than just GitHub commits.
The term event encompasses the number of code pushes, pull request interactions, GitHub wiki edits, and more. The upshot is that greater activity generally equals greater belief in the eventual success of the project.
It is a metric that goes a long way to assure investors that the project will be pushing out more features and reduces the probability that the project is a scam.
Technical analysis highlights two key levels, but there’s a catch
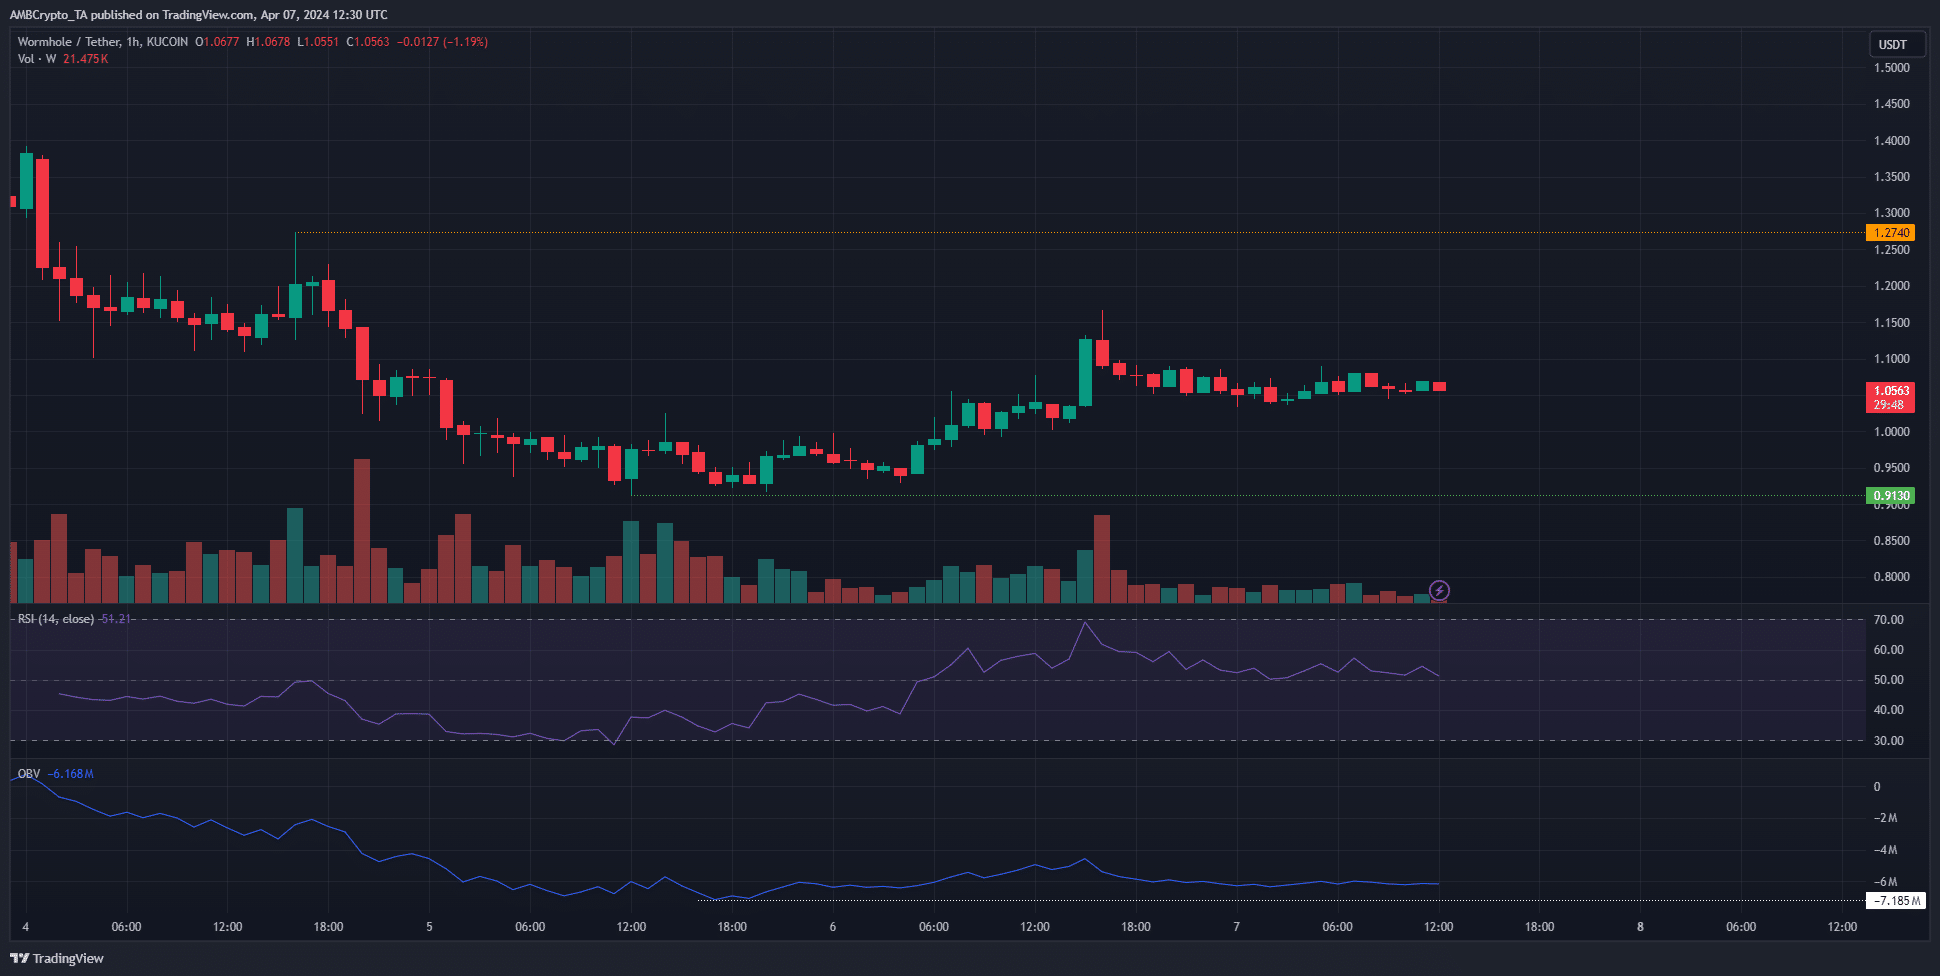
Source: W/USDT on TradingView
The 1-hour chart of W revealed a bearish market structure. The $0.913 swing low, if breached, would signal a bearish continuation and further losses for the token.
The price saw a bounce from $0.913 to $1.05 in the past two days. Alongside, the OBV also climbed slightly higher. Yet, the trading volume has trended downward since the 5th of March.
The H1 chart’s RSI was at 51, showing neither bulls nor bears had the upper hand in the short term.
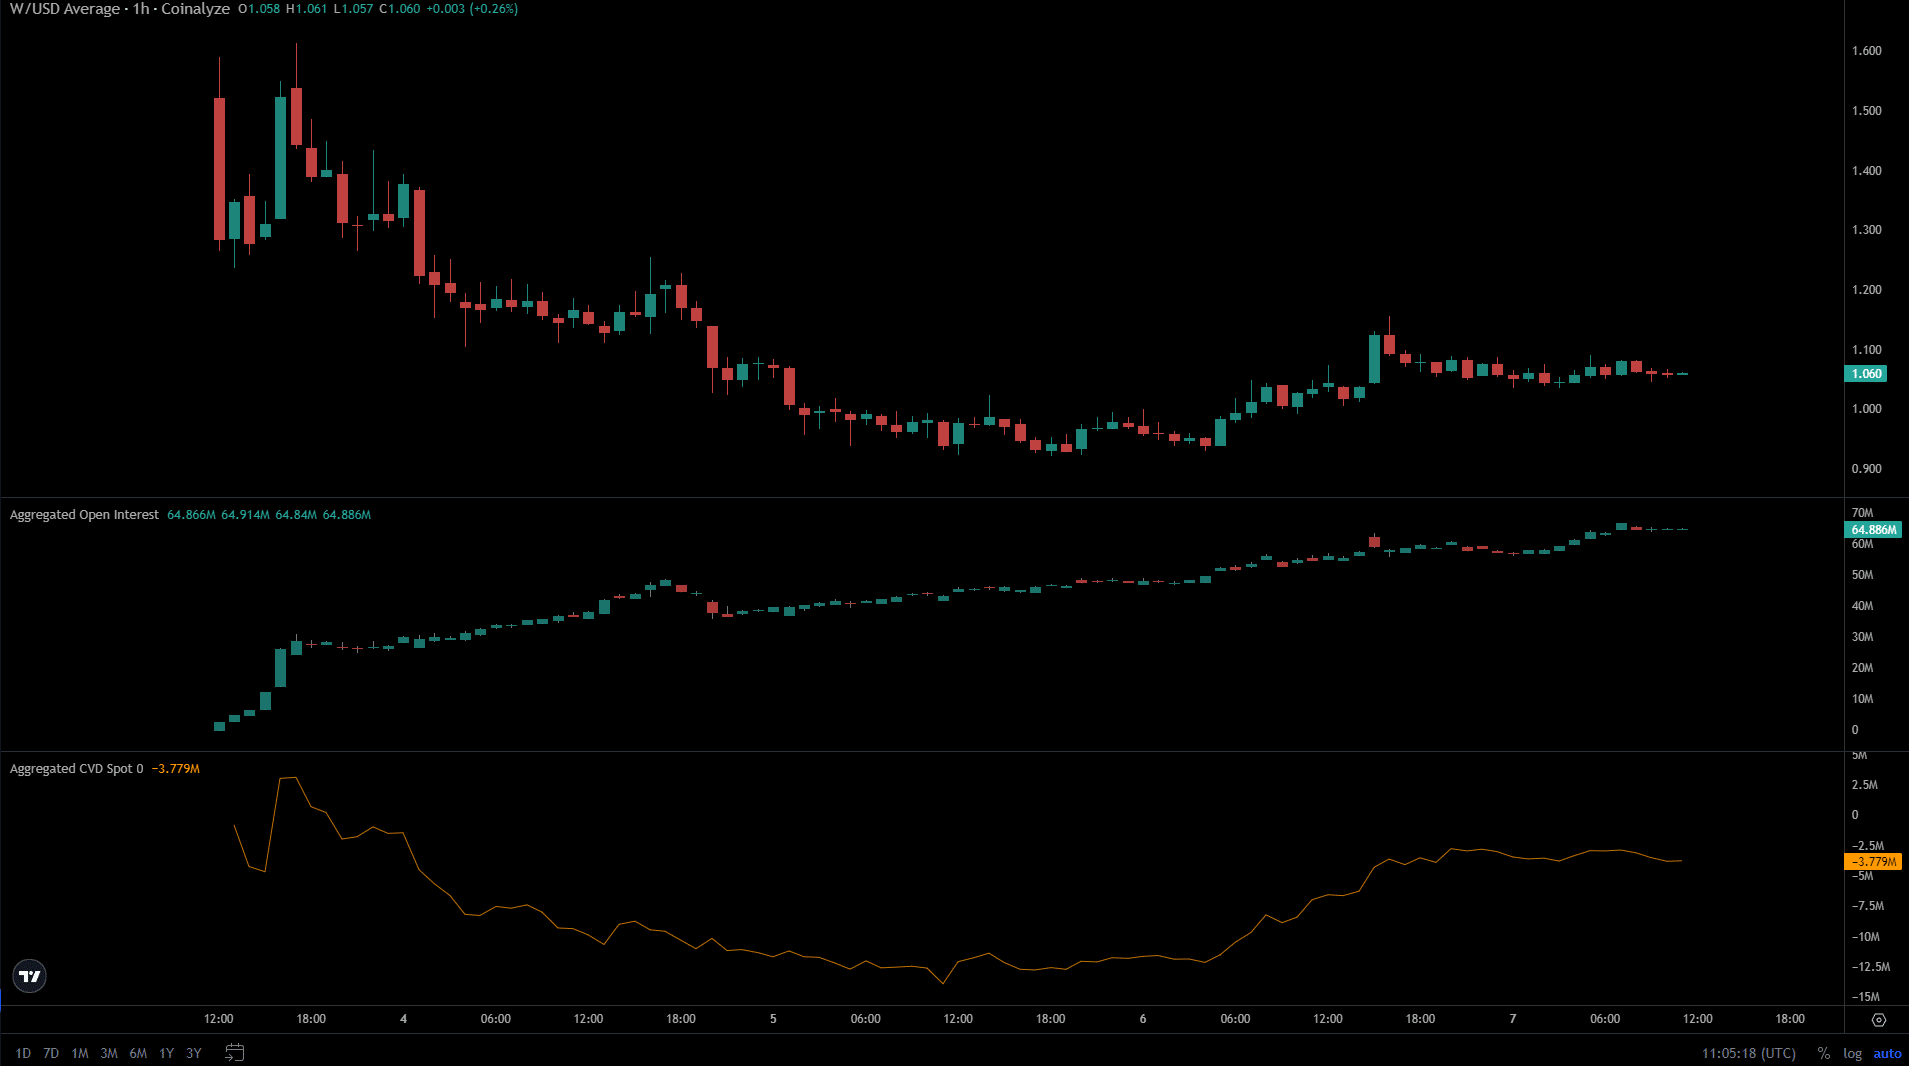
Source: Coinalyze
Conversely, the spot CVD of W saw a sizeable uptick in the past 24 hours. This pointed toward growing demand in the spot markets.
The Open Interest was also trending upward, even as prices struggled to arrest their decline.
Is your portfolio green? Check out the W Profit Calculator
The catch here is that the price action is very young. With only a few days’ worth of trading data available, it is hard to map out where W could move next.
As things stand, the $1.27 level, if broken, could see a rally ensue for Wormhole.