
- dogwifhat has retested key support levels as resistances in recent weeks, highlighting a strong downtrend.
- This trend has not yet halted, and lower timeframe buying pressure might not be enough to reverse the trend.
dogwifhat [WIF] and the rest of the major memecoins suffered significant losses in the past few weeks. Since the local high at $4.08 on the 29th of May, WIF has shed 54% and traded at $1.86 at press time.
It was ranked 50th on CoinMarketCap, much lower than a month ago. The $10 price prediction did not come to pass due to the shift in market sentiment. Is dogwifhat on course for more losses, or should traders anticipate a recovery?
The southward Fibonacci extension is the next price target
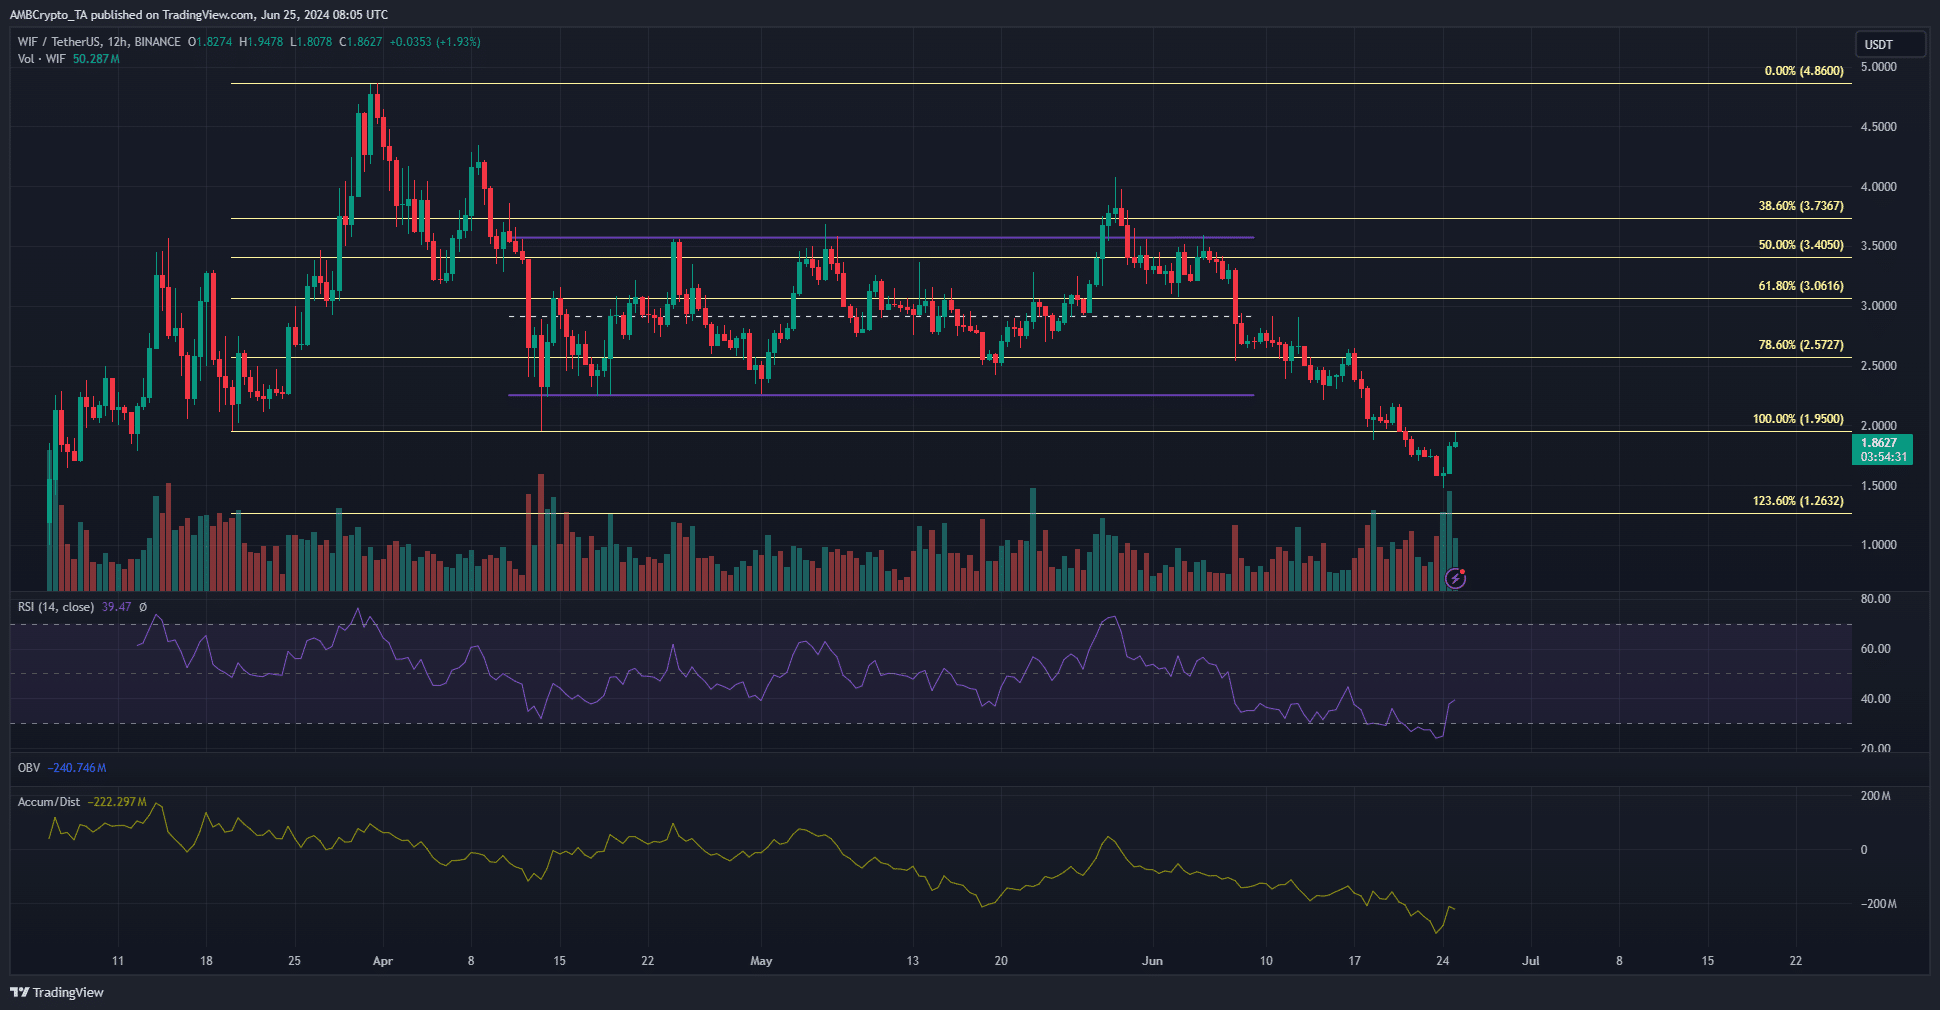
Source: WIF/USDT on TradingView
The market structure of WIF was strongly bearish. On the 15th of June, the prices bounced from the range lows, as they had done multiple times in April, but the bulls were unable to force a rally this time.
Instead, the bounce lost momentum just above the $2.57 level and sunk lower. This retest of the 78.6% Fibonacci retracement level as resistance was evidence that the 100% level and potentially southward extensions could be the next support levels.
At press time, the $1.95 level had been retested as resistance and the bears remained in control.
The Accumulation/Distribution chart was in a firm downtrend over the past month. The daily RSI was also below neutral 50 to denote a firm downtrend in progress.
Hence, a move to the $1.26 support level is likely to commence soon.
The short-term sentiment was bearish and buyers lacked strength
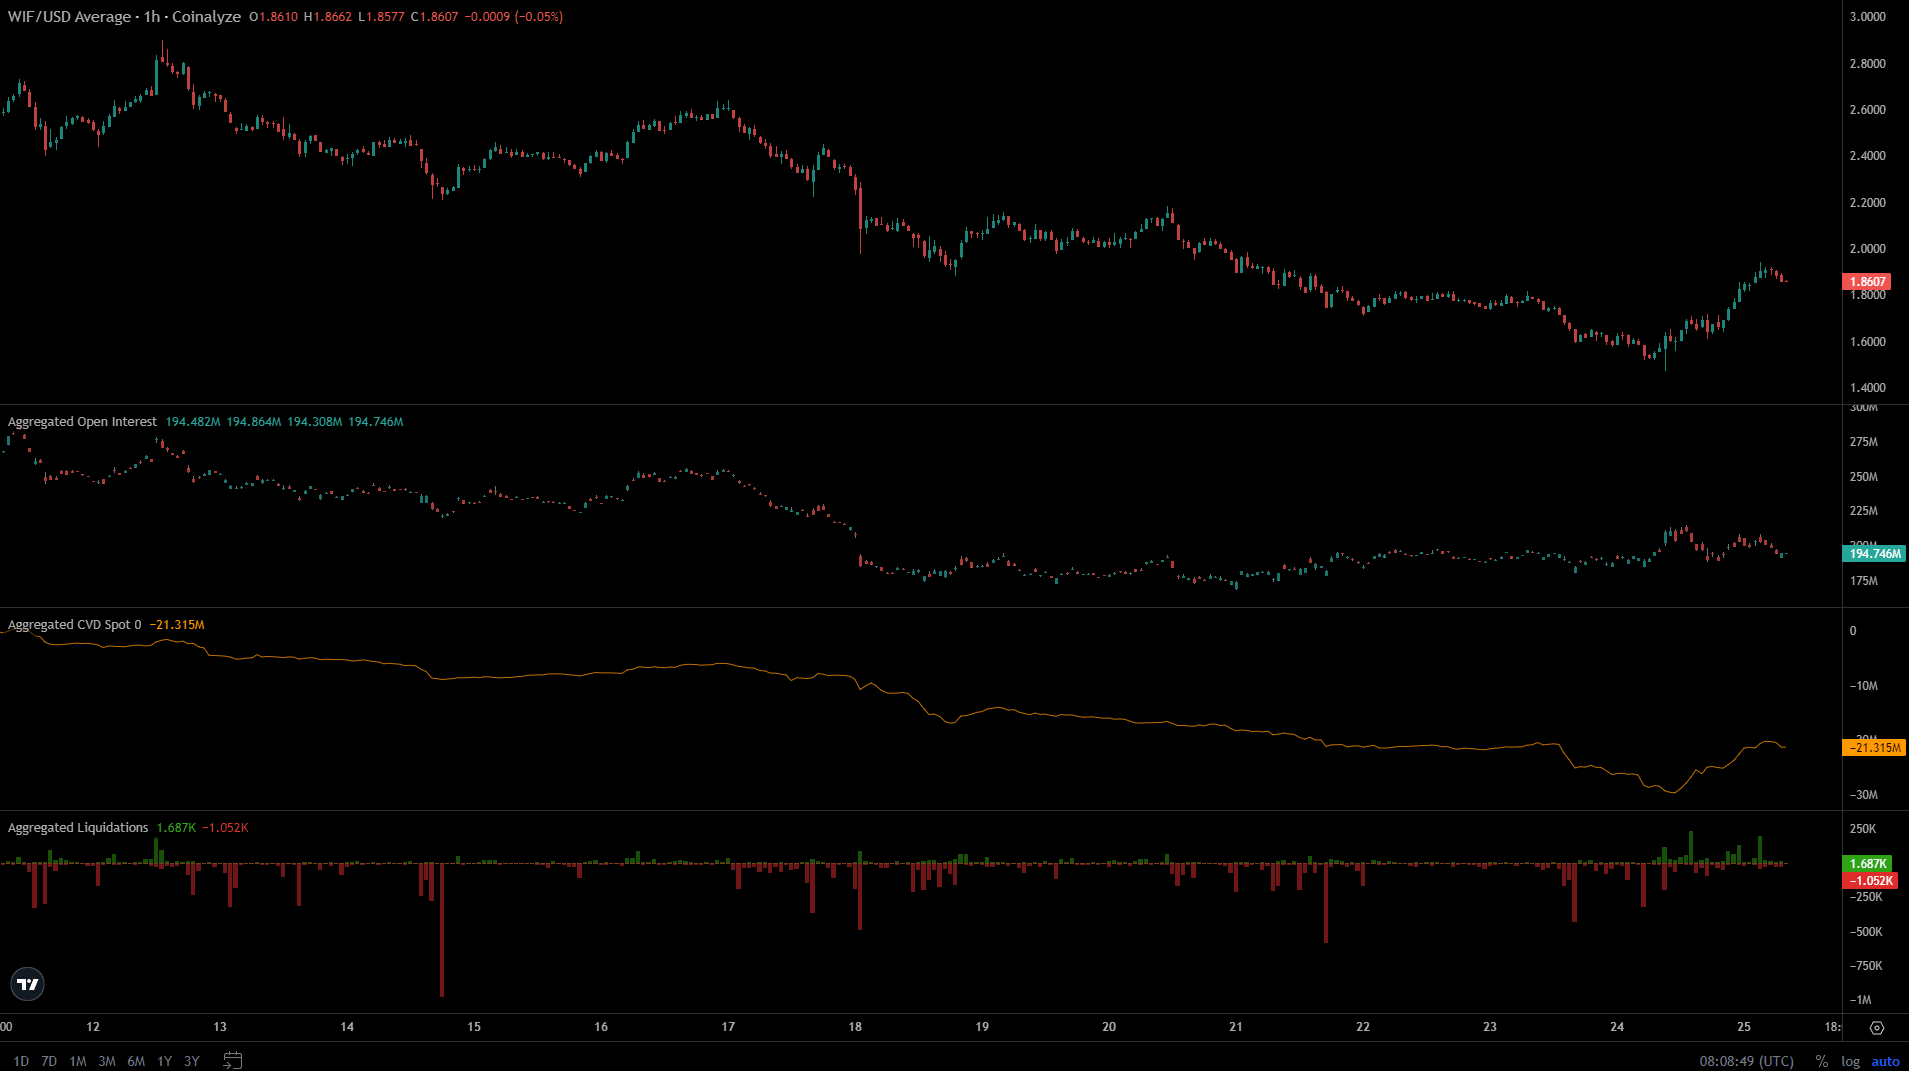
Source: Coinalyze
The higher timeframes and the lower timeframe charts were both in bearish favor. The 1-hour chart from Coinalyze showed that the Open Interest tried and failed to pick up in the past 24 hours. At this time WIF bounced from $1.47 to $1.95.
Is your portfolio green? Check the WIF Profit Calculator
The OI’s failure meant futures traders did not believe in recovery and were reluctant to bid. The spot CVD saw a bounce, which was an encouraging sight.
There was a spree of short liquidations in the past 24 hours due to the price bounce. Short sellers might be profitable in the coming days, but the spot CVD’s trend is something they should keep an eye on.
Disclaimer: The information presented does not constitute financial, investment, trading, or other types of advice and is solely the writer’s opinion.